
Year-on-Year
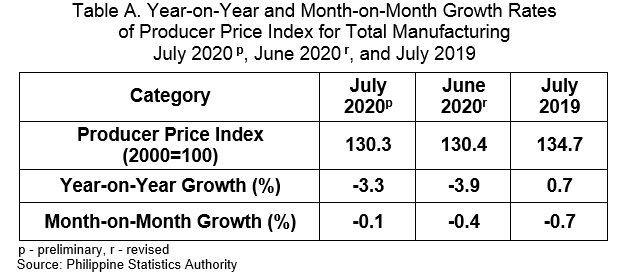
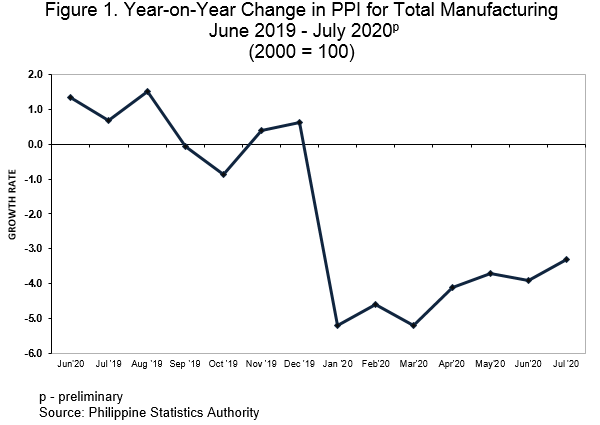
The Producer Price Index (PPI, 2000=100) for manufacturing remained at a downward trend with an annual rate of -3.3 percent in July 2020. This decline was slower compared with the previous month’s annual rate of -3.9 percent. On the contrary, PPI increased at an annual rate of 0.7 percent in July 2019.
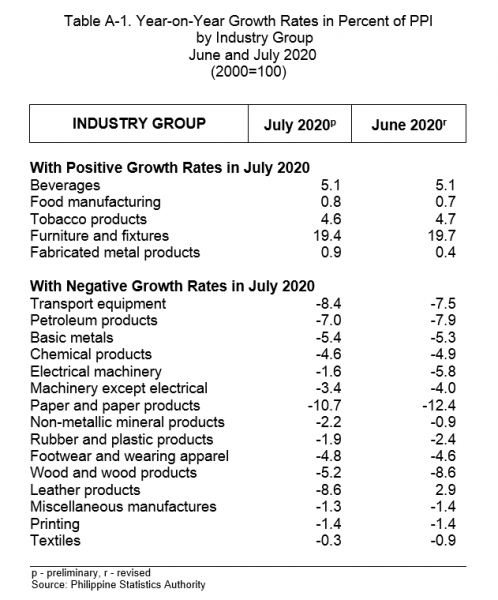
The decline in the PPI in July 2020 can be attributed to the decreases in the indices of 15 industry groups led by paper and paper products by posting a -10.7 percent decline. On the other hand, furniture and fixtures, which increased by 19.4 percent, led the five industry groups that posted annual increments. (Tables A-1 and 1)
Month-on-Month
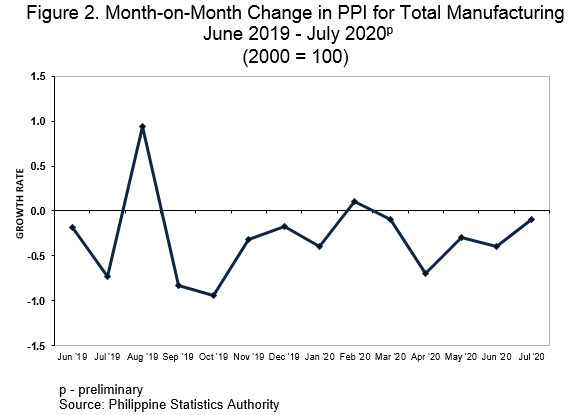
Month-on-month, the PPI posted a slight decrement of -0.1 percent in July 2020, after a faster drop of -0.4 percent in the previous month. Moreover, the PPI also posted a -0.7 percent monthly decrease last July 2019.
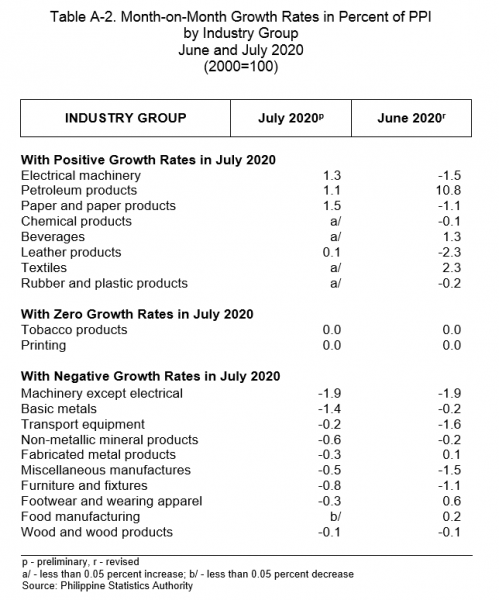
Half of the 20 industry groups posted negative monthly growth rates in July 2020 which was led by machinery except electrical (-1.9%). On the other hand, PPI for eight industry groups registered positive monthly increments while indices for two industry groups exhibited zero monthly growth. (Tables A-2 and 1)
DENNIS S. MAPA, Ph.D.
Undersecretary
National Statistician and Civil Registrar General
- Introduction
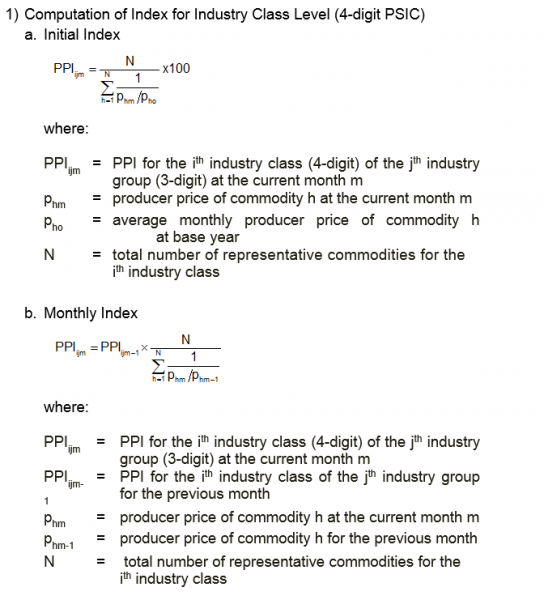
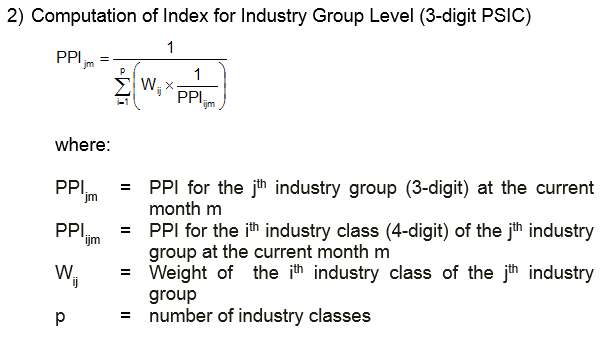
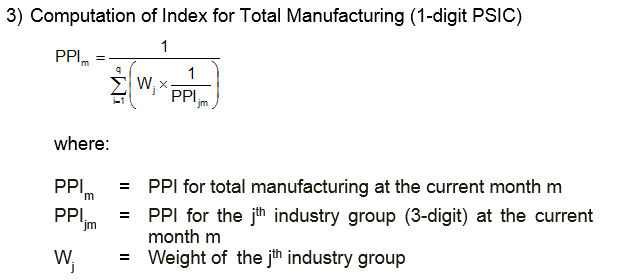
- Method of Index Computation
Note:
Starting with the January 2017 PPI, a link factor has been used to adjust weight effects to measure the correct price change.
- Computation of Growth Rates
Year-on-year growth rates are computed by dividing the current month index by the index in the same month of the previous year less 1.
Month-on-month growth rates are computed by dividing the current month index by the previous month’s index less 1.
- Imputation and Revision
Imputation is done for sample establishments that are in operation during the reference period but no received response during the release date. Results are revised accordingly when the actual data are received and these revisions are reflected in the next release.
- Industry Coverage
Starting with the January 2013 reference month, the PPI utilizes the 2009 Philippine Standard Industrial Classification (PSIC) to classify sectors and industries. Selected industry classes of the 2009 PSIC were grouped to form the 20 major industry groupings of the 2020 PPS. These are presented in the table below.
|
2009 PSIC CODE |
INDUSTRY DESCRIPTION |
|---|---|
|
C10 |
Food manufacturing * |
|
C11 |
Beverages |
|
C12 |
Tobacco products |
|
C13 |
Textiles* |
|
C14, C152 |
Footwear and wearing apparel |
|
C151 |
Leather products |
|
C16 |
Wood and wood products* |
|
C17 |
Paper and paper products |
|
C18 |
Printing |
|
C19 |
Petroleum products* |
|
C20, C21 |
Chemical products* |
|
C22 |
Rubber and plastic products* |
|
C23 |
Non-metallic mineral products* |
|
C24 |
Basic Metals* |
|
C25 |
Fabricated metal products |
|
C262, C275, C28, C263, C268 |
Machinery except electrical* |
|
C261, C264, C27, C29301 |
Electrical machinery* |
|
C29 except C29301, C30 |
Transport equipment |
|
C31 |
Furniture and fixtures |
|
C265, C266, C267, C32 |
Miscellaneous manufactures |
* - Industry groups categorized into industry classes
See more at the Producer Price Survey (PPS) main page.