Table A Year-on-Year Growth Rates for Production Index, Net Sales Index
and Producer Price Index
April 2020, March 2020 and April 2019
(In Percent)
TOTAL MANUFACTURING | APRIL 2020p | MARCH 2020r | APRIL 2019 |
| Production Index (2000=100) |
| ||
| Value (VaPI) | -61.4 | -12.4 | -11.8 |
| Volume (VoPI) | -59.8 | -7.7 | -14.0 |
| Net Sales Index (2000=100) |
|
| |
| Value (VaNSI) | -68.5 | -15.8 | -4.2 |
| Volume (VoNSI) | -67.2 | -11.2 | -6.5 |
| Producer Price Index (2000=100) | -3.9 | -5.1 | 2.5 |
p - preliminary
r - revised
PRODUCTION
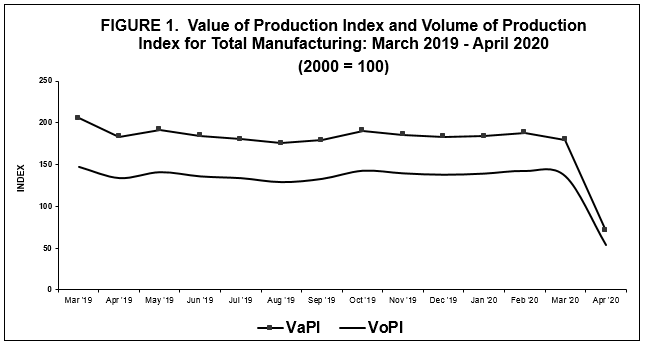
Value of Production Index abruptly drops in April 2020
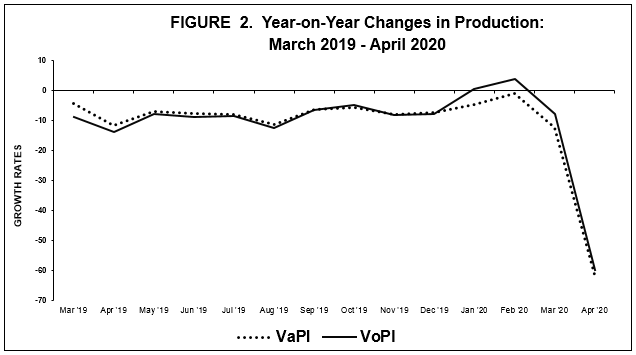
Based on the preliminary results of the Monthly Integrated Survey of Selected Industries (MISSI), Value of Production Index (VaPI) for Manufacturing sector plummeted at an annual rate of 61.4 percent in April 2020. This contraction was the highest recorded annual decrease in VaPI since 2001. (Table A)
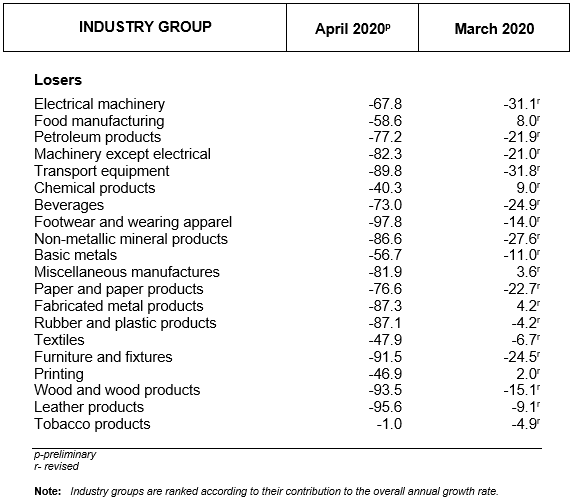
The decline in VaPI in April 2020 was due to the downward movements noted in all the 20 industry groups, seven of which registered more than 85 percent decrements in VaPI. These were leather products (-98.6%), footwear and wearing apparel (-98.0%), furniture and fixtures (-90.0%), fabricated metal products (-89.9%), non-metallic mineral products (-87.7%), rubber and plastic products (-87.7%) and tobacco products (-86.8%). (Tables 1 and 1-A)
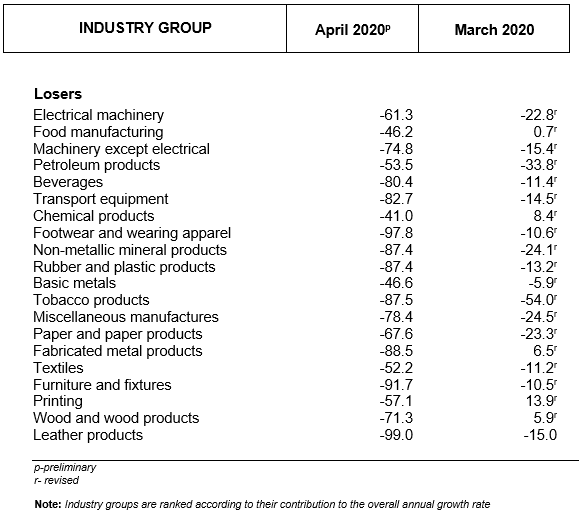
Volume of Production Index also plunges
The Volume of Production Index (VoPI) also plunged to an annual rate of 59.8 percent in April 2020. As for VoPI, this month’s annual decline was the highest since 2001. (Table A)
The downturn in VoPI was driven by the significant decreases in indices of all industry groups, of which, three were in a very minimal business operations, namely: leather products (-99.0%), footwear and wearing apparel (-97.8%) and furniture and fixtures (-91.7%). (Tables 1-B and 2)
NET SALES
Value of Net Sales Index continues to decelerate
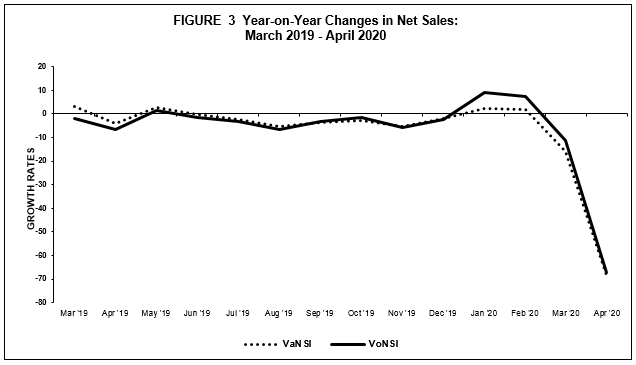
Value of Net Sales Index (VaNSI) likewise decelerated at a faster rate of 68.5 percent in April 2020 as compared to the annual decline of 15.8 percent in the previous month. In April 2019, VaNSI dropped at a slower rate of 4.2 percent than the rate in April 2020. (Table A)
The decrease was brought about by declines in the indices of all the industry groups, except tobacco products. Four of the industry groups exhibited a downturn of more than 90 percent, namely: footwear and wearing apparel (-98.0%), leather products (-96.3%), wood and wood products (-94.0%), and transport equipment (-90.2%). (Tables 2-A and 3)
Volume of Net Sales Index likewise drops
The Volume of Net Sales Index (VoNSI), on a year-on-year basis, registered an abrupt decrease in annual rate with 67.2 percent in April 2020. In the previous month, the annual decrease was slower at 11.2 percent. (Table A)
All of the industry groups pulled-down the VoNSI with the following industry groups exhibiting at least 90 percent decreases: footwear and wearing apparel (-97.8%), leather products (-95.6%), wood and wood products (-93.5%), and furniture and fixtures (-91.5%). (Tables 2-B and 4)
CAPACITY UTILIZATION
Average Capacity Utilization Rate for total manufacturing stands at 70.0 percent
Based on the responding establishments, average capacity utilization rate for total manufacturing in April 2020 was posted at 70.0 percent which was lower than the average capacity utilization rate of responding establishments in March 2020 at 77.9 percent.
Four of the 20 industry groups had at least 80 percent capacity utilization rate which was led by footwear and wearing apparel (87.4%), textiles (87.2%), rubber and plastic products (80.3%) and electrical machinery (80.1%). (Table 6)
More than one-fifth of total responding manufacturing establishments operate at full capacity
The proportion of establishments that operated at full capacity (90% to 100%) was more than one-fifth (23.9%) of the total number of responding establishments for manufacturing. More than two-fifths (43.1%) operated at 70 to 89 percent capacity while one-third (33.0%) operated below 70 percent capacity. (Table B)
Table B Distribution of Responding Establishments
by Capacity Utilization for Total Manufacturing: April 2020
Capacity Utilization | Number of Responding Establishments | Percent Share to Responding Establishments |
| TOTAL | 197 | 100.0 |
Below 50% | 21 | 10.7 |
50% - 59% | 19 | 9.6 |
60% - 69% | 25 | 12.7 |
70% - 79% | 38 | 19.2 |
80% - 89% | 47 | 23.9 |
90% - 100% | 47 | 23.9 |
Notes:
1) Based on the responses of establishments which were in operation during the reference month.
2) There were additional 198 establishments which responded but were not included in the tabulation as they temporarily ceased their business operations.
(Sgd.) CLAIRE DENNIS S. MAPA, Ph. D.
Undersecretary
National Statistician and Civil Registrar General
by Industry Group
March 2020 and April 2020
(2000 = 100)
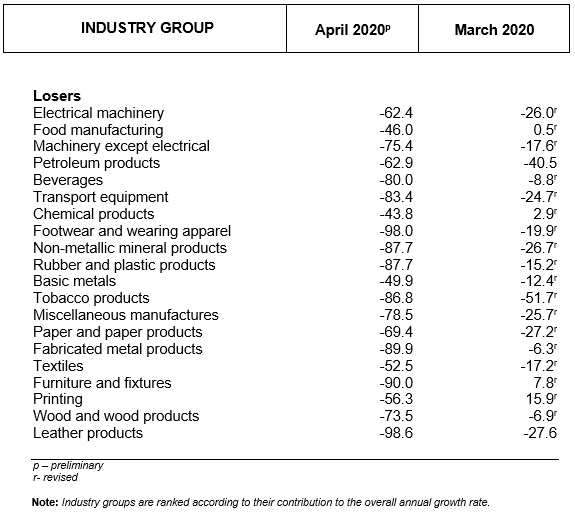
TABLE 1-B Year-on-Year Growth Rate (%) of Volume of Production Index
by Industry Group
March 2020 and April 2020
(2000 = 100)
by Industry Group
March 2020 and April 2020
(2000 = 100)
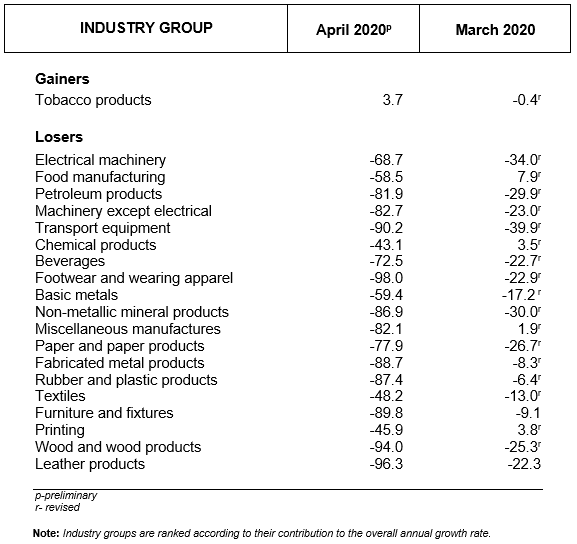
TABLE 2-B Year-on-Year Growth Rate (%) of Volume of Net Sales Index
by Industry Group
March 2020 and April 2020
(2000 = 100)