
Release Date :
Reference Number :
2020-004
RICE
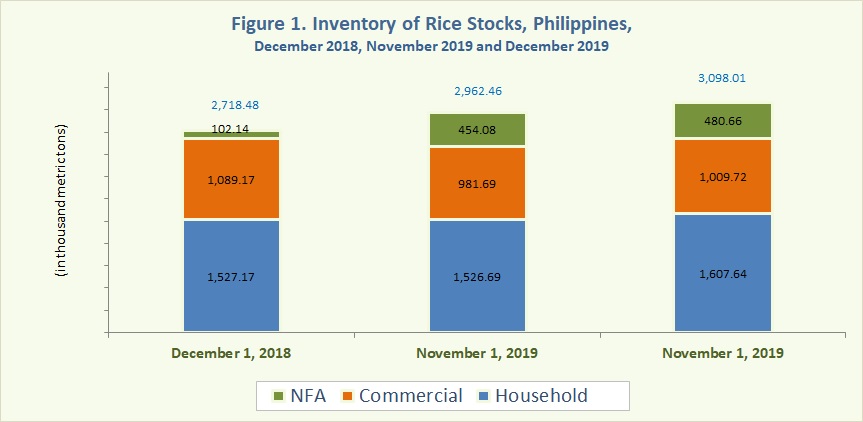
- As of 01 December 2019, the total rice stocks inventory level was 3,098.01 thousand metric tons. It increased by 14.0 percent and 4.6 percent compared with the previous year's level of 2,718.48 thousand metric tons and previous month's level of 2,962.46 thousand metric tons, respectively. (Figure 1 and Table 1)
- Stocks in the households grew by 5.3 percent compared with previous year's level of 1,527.17 thousand metric tons. A surge of 370.6 percent was noted in NFA depositories. On the other hand, a decrease of 7.3 percent was observed in commercial warehouses. (Figure 1 and Table 1)
- Month-on-month, rice stocks inventory in all sectors increased. Increases of 5.3 percent, 2.9 percent, and 5.9 percent were noted in the households, commercial warehouses, and NFA depositories, respectively. (Table 1)
- Of the total rice stocks inventory during the month, 51.9 percent were from the households, 32.6 percent from commercial warehouses, and 15.5 percent from NFA depositories. (Table 1)
CORN
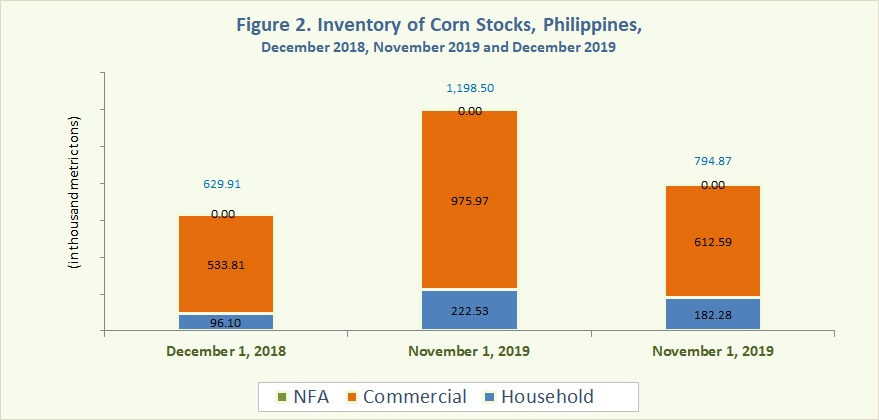
- The total corn stocks inventory as of 01 December 2019 was 794.87 thousand metric tons. This was higher by 26.2 percent compared with previous year's level of 629.91 thousand metric tons but lower by 33.7 percent than previos month's level of 1,198.50 thousand metric tons. (Figure 1 and Table 2)
- With reference to the previous year's level, stocks in both households and commercial warehouses increased respectively by 89.7 percent and 14.8 percent. Meanwhile, there were no corn stocks in NFA depositories for this month. (Table 2)
- Compared with previous month's level, a decrease of 18.1 percent and 37.2 percent was recorded in the household and commercial warehouses, respectively. (Table 2)
- Of the total corn stocks inventory, 77.1 percent were from commercial warehouses and the remaining 22.9 percent were from the households. (Table 2)
ROSALINDA P. BAUTISTA
Assistant Secretary
Deputy National Statistician
Sectoral Statistics Office
Technical Notes
Monthly rice and corn stocks inventory are generated from three sectors, namely: household, commercial, and National Food Authority (NFA). The household stocks are taken from the results of Palay and Corn Stocks Survey (PCSS) of the Philippine Statistics Authority (PSA), which covers farming and non-farming households nationwide. The commercial stocks are sourced from registered grains businessmen through the Commercial Stocks Survey (CSS). The CSS is conducted by NFA, the results of which are submitted to PSA. NFA stocks are monitored from their warehouses/depositories.
| Attachment | Size |
|---|---|
|
|
292.61 KB |