
Release Date :
Reference Number :
2020-051
RICE
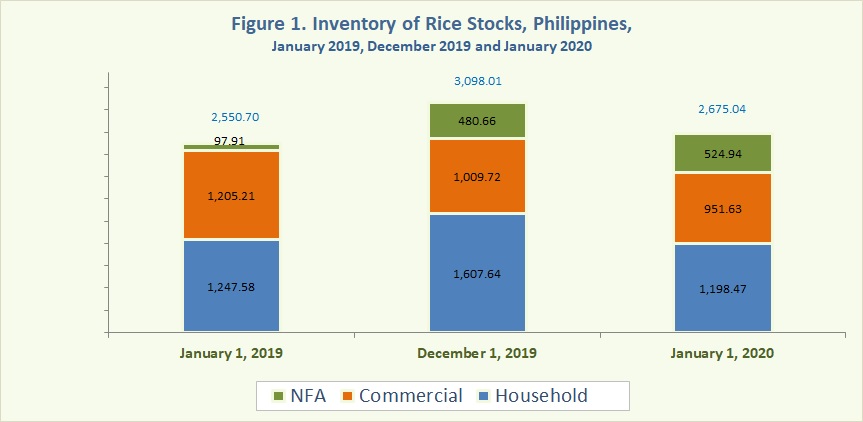
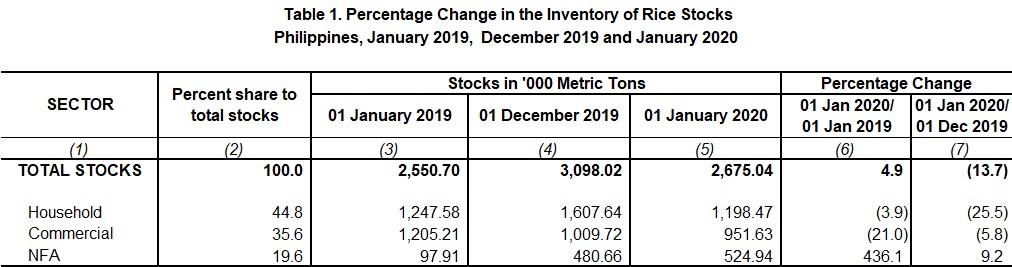
- A total of 2,675.04 thousand metric tons of rice stocks inventory was recorded as of 01 January 2020. This was higher by 4.9 percent compared with previous year's level of 2,550.70 thousand metric tons. However, a decrease of 13.7 percent was noted in comparison to last month's level of 3,098.02 thousand metric tons. (Figure 1 and Table 1)
- Compared with the previous year’s record, rice stocks in the households and commercial warehouses displayed a decrease of 3.9 percent and 21.0 percent, respectively. Stocks in NFA depositories rose by 436.1 percent from its previous year’s level. (Table 1)
- Rice stocks inventory in the households and commercial warehouses declined by 25.5 percent and 5.8 percent, respectively from their previous month’s levels. However, an increase of 9.2 percent was noted in NFA depositories. (Table 1)
- Of this month’s rice stocks, around 44.8 percent were from the households, 35.6 percent from commercial warehouses, and 19.6 percent from NFA depositories. (Table 1)
CORN
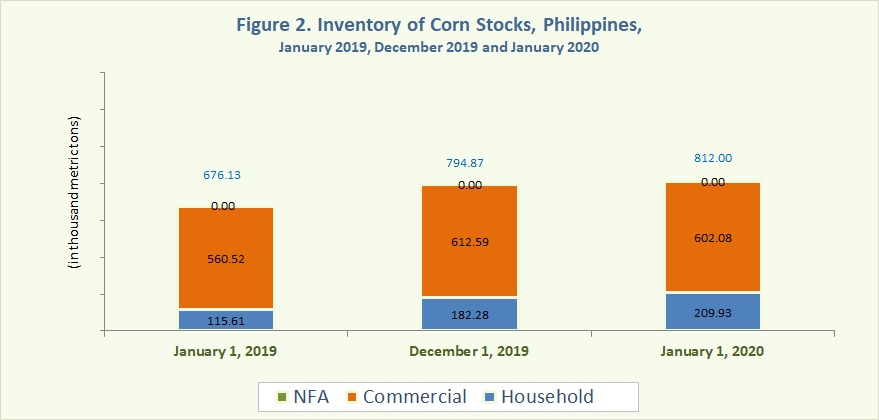
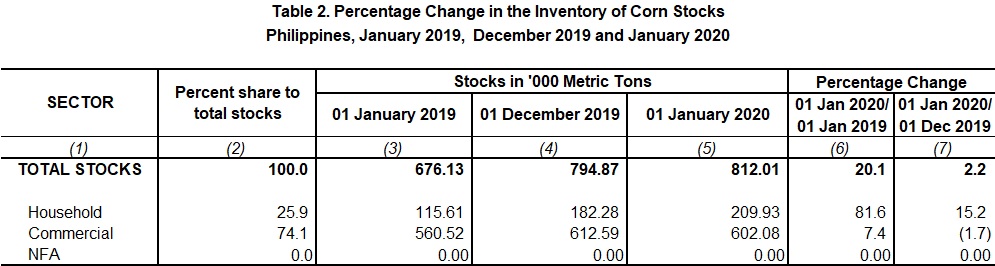
- As of 01 January 2020, corn stocks inventory peaked at 812.01 thousand metric tons. The level of stocks was 20.1 percent above the previous year's record of 676.13 thousand metric tons and 2.2 percent higher than the previous month’s level of 794.87 thousand metric tons. (Figure 2 and Table 2)
- Year-on-year, both corn stocks inventory level in the households and commercial warehouses increased by 81.6 percent and 7.4 percent, respectively. There were no recorded stocks in NFA depositories for two consecutive years. (Table 2)
- Corn stocks inventory level in the household recorded an increase of 15.2 percent than the previous month's level of 115.61 thousand metric tons. In commercial warehouses, a decrease of 1.7 percent was noted. (Table 2)
- As of 01 January 2020, around 74.1 percent of the total corn stocks inventory were from the commercial warehouses and 25.9 percent were from the households. (Table 2)
ROSALINDA P. BAUTISTA
Assistant Secretary
Deputy National Statistician
Sectoral Statistics Office
Technical Notes
Monthly rice and corn stocks inventory are generated from three sectors, namely: household, commercial, and National Food Authority (NFA). The household stocks are taken from the results of Palay and Corn Stocks Survey (PCSS) of the Philippine Statistics Authority (PSA), which covers farming and non-farming households nationwide. The commercial stocks are sourced from registered grains businessmen through the Commercial Stocks Survey (CSS). The CSS is conducted by NFA, the results of which are submitted to PSA. NFA stocks are monitored from their warehouses/depositories.
| Attachment | Size |
|---|---|
|
|
250.18 KB |