
Release Date :
Reference Number :
2019-193
RICE
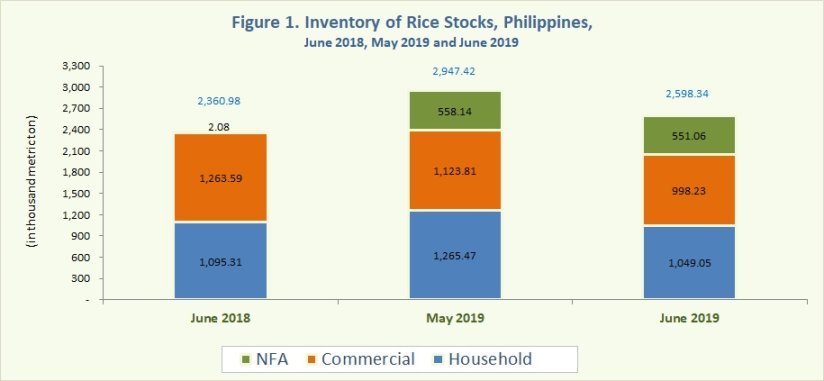
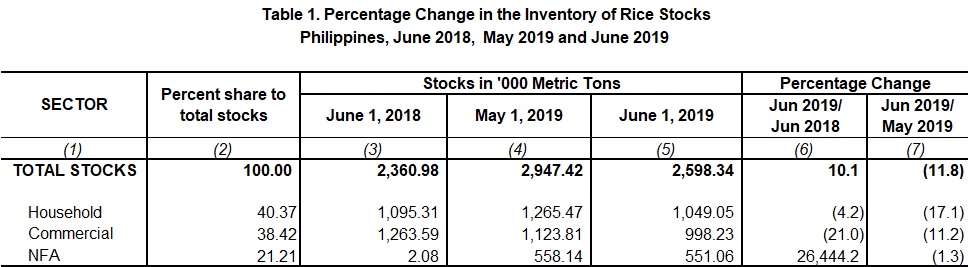
- As of 01 June 2019, the total rice stocks inventory was recorded at 2,598.34 thousand metric tons. An increase of 10.1 percent was observed from the previous year's level of 2,360.98 thousand metric tons. However, this was 11.8 percent lower than the previous month's stocks level of 2,947.42 thousand metric tons (Figure 1).
- Rice stocks inventory level in the households and commercial warehouses were down by 4.2 percent and 21.0 percent, respectively. Whereas, stocks in NFA depositories increased by 26,444.2 percent (Table 1).
- Compared with their levels a month ago, decrements were noted in all sectors. Stocks in the households, commercial warehouses and NFA depositories were lower by 17.1 percent, 11.2 percent and 1.3 percent, respectively (Table 1).
- Of this month's total rice stocks inventory, 40.4 percent came from the households and 38.4 percent were from commercial warehouses. The NFA depositories contributed 21.2 percent of the total rice stocks inventory, comprising 66.5 percent of imported rice for the reference period.
CORN
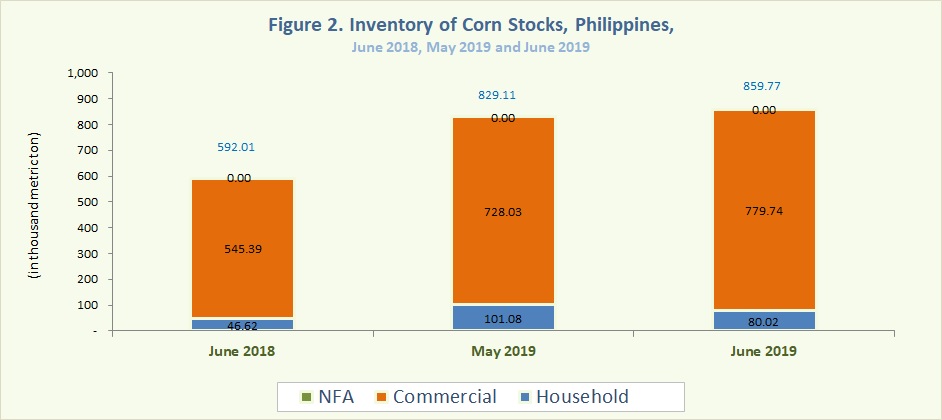
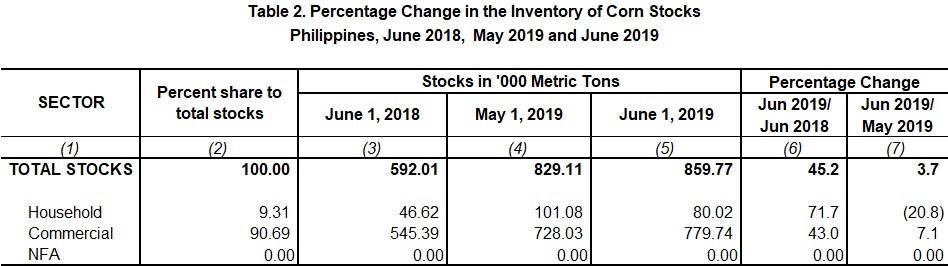
- The total corn stocks inventory as of 01 June 2019 was 859.77 thousand metric tons. It grew by 45.2 percent compared with the June 2018 inventory level of 592.01 thousand metric tons and 3.7 percent higher than the 829.11 thousand metric tons inventory level of the previous month (Figure 2).
- Relative to their levels from the previous year, increments were noted in the households and commercial warehouses by 71.7 percent and 43.0 percent, respectively. On the other hand, there were no corn stocks in NFA depositories during the month (Table 2).
- Stocks in the households decreased by 20.8 percent with reference to the previous month's inventory level. In contrast, stocks in commercial warehouses increased by 7.1 percent. Still, there were no corn stocks in NFA depositories for the month (Table 2).
- Around 9.3 percent of the current stocks inventory level were contributed by the households and 90.7 percent were from commercial warehouses.
ROSALINDA P. BAUTISTA
(Director II)
Officer-in-Charge
Sectoral Statistics Office
Technical Notes
Monthly rice and corn stocks inventory are generated from three sectors, namely: household, commercial, and National Food Authority (NFA). The household stocks are taken from the results of Palay and Corn Stocks Survey (PCSS) of the PSA, which covers farming and non-farming households nationwide. The commercial stocks are sourced from registered grains businessmen through the Commercial Stocks Survey (CSS). The CSS is conducted by the NFA, the results of which are submitted to PSA. NFA stocks are monitored from their warehouses/depositories.
| Attachment | Size |
|---|---|
|
|
239.36 KB |