
Release Date :
Reference Number :
2018-267
RICE
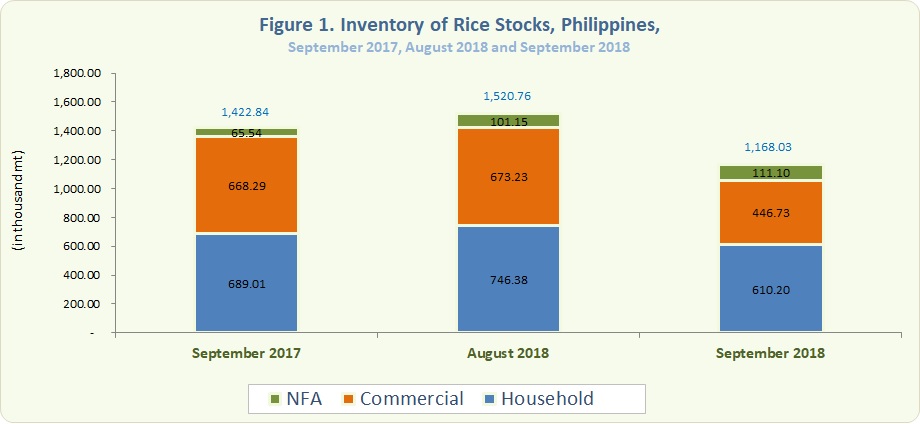
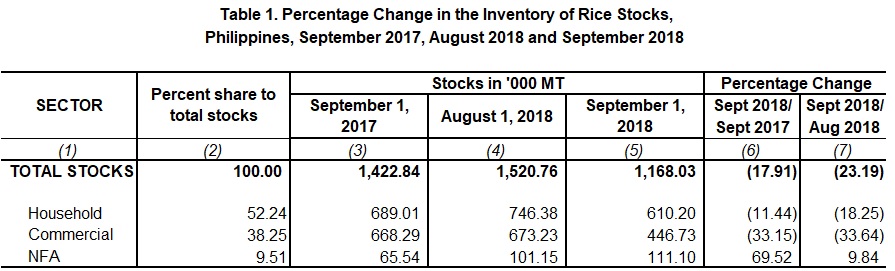
- The total rice stock inventory as of 01 September 2018 was 1,168.03 thousand metric tons (Figure 1). The level of stocks was 17.91 percent below the previous year's level of 1,422.84 thousand metric tons. This was 23.19 percent lower than last month's inventory level of 1,520.76 thousand metric tons (Table 1).
- Compared to the previous year, rice stocks in NFA depositories increased by 69.52 percent. However, stocks in households and commercial warehouses decreased by 11.44 percent and 33.64 percent, respectively (Table 1).
- Compared with their levels last month, rice stocks in households and commercial warehouses declined by 18.25 percent and 33.64 percent, respectively. On the other hand, rice stocks in NFA depositories as of 01 September 2018 grew by 9.84 percent from the previous month’s inventory level.
- Of this month’s total rice stocks inventory, more than half (52.24%) were from the households, 38.25 percent from commercial warehouses and the remaining 9.51 percent were from NFA depositories. The latter comprised 91.57 percent of the imported rice.
CORN
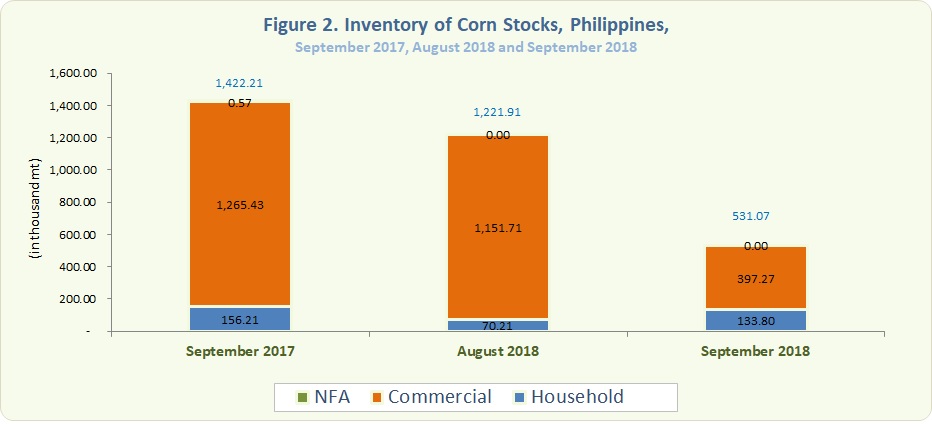
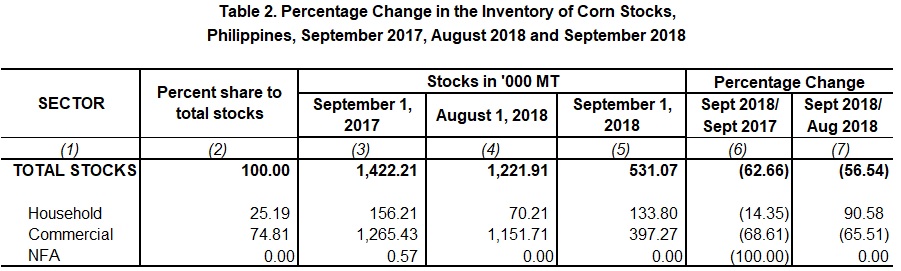
- As of 01 September 2018, the total corn stocks inventory was 531.07 thousand metric tons (Figure 2). This was 62.66 percent lower than the last year's record of 531.07 thousand metric tons. Likewise, corn stocks inventory for the period was down by 56.54% from the previous month’s stock level (Table 2).
- Year-on-year, corn stocks inventory in the households and commercial warehouses decreased by 14.35 percent and 68.61 percent, respectively. There were no corn stocks in NFA depositories as of September 2018 (Table 2).
- Compared with last month, corn stock in the households was almost twice from the previous month’s level of 70.21 thousand metric tons. However, commercial stocks dropped by 65.51 percent. As of August 2018, there were also no stocks in NFA depositories.
- Around 74.81 percent of this month’s total corn stocks inventories were in commercial warehouses and the remaining 25.19 percent were with the households.
ROSALlNDA P. BAUTISTA
(Director II)
Officer-in-Charge
Sectoral Statistics Office
Technical Notes
Monthly rice and corn stocks inventory are generated from three sectors, namely: household, commercial, and National Food Authority (NFA). The household stocks are taken from the Palay and Corn Stocks Survey (PCSS) of the PSA, which covers farming and non-farming households nationwide. The commercial stocks are sourced from registered grains businessmen through the Commercial Stocks Survey (CSS). The CSS is conducted by the NFA, the results of which are submitted to PSA. NFA stocks are monitored from their warehouses/depositories.
| Attachment | Size |
|---|---|
|
|
581.18 KB |