
Release Date :
RICE
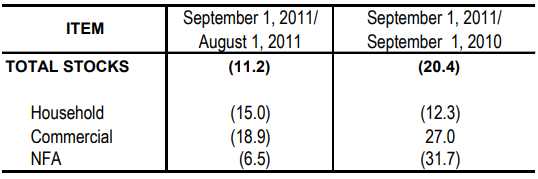
- The September 1, 2011 total rice stock inventory was 2.41 million metric tons (Figure 1). This was 11.2 percent lower than the previous month’s record of 2.72 million metric tons and 20.4 percent below last year’s inventory of 3.03 million metric tons (Table 1).
- This month’s records were lower than last month’s stock levels in all sectors. Stocks were down by 15.0 percent in the households and by 18.9 percent in commercial warehouses. Stocks in NFA depositories of which 68 percent were imported rice, dropped by 6.5 percent.
- Compared to last year’s levels, stocks in the households went lower by 12.3 percent and those in NFA depositories, by 31.7 percent. On the contrary, stocks in commercial warehouses grew by 27.0 percent.
- As of September 1, 2011, the total volume of rice stocks would be enough for 71 days. Stocks in NFA depositories would be good for 41 days, while those in commercial warehouses would cover 14 days. Household stocks would last for 16 days.
- Of the current stock level, about 23 percent were with the households, 20 percent were with the commercial warehouses and 57 percent were with the NFA depositories.
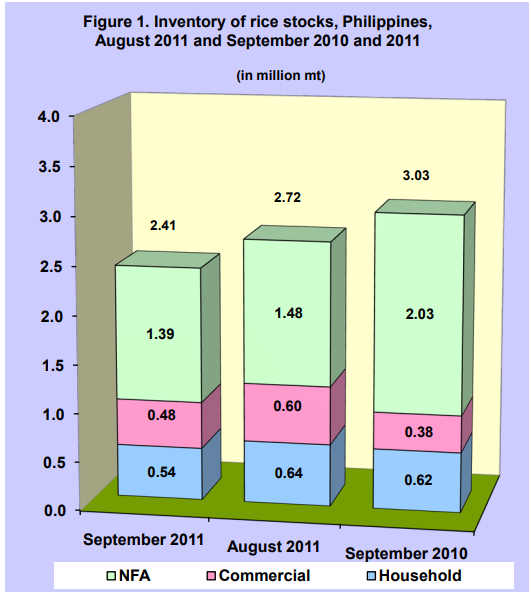
Table 1. Percentage change in the inventory of rice stocks,
Philippines, August 2011 and September 2010 and 2011
CORN
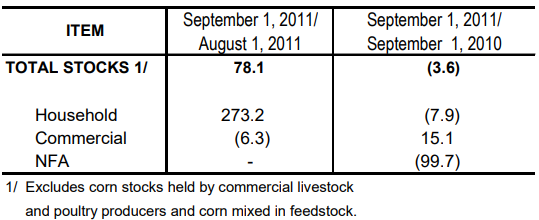
- The total corn stock inventory as of September 1, 2011 was 279.6 thousand metric tons (Figure 2). This was 78.1 percent higher than last month’s level of 157.0 thousand metric tons, but 3.6 percent below last year’s record of 290.0 thousand metric tons (Table 2).
- Comparative estimates with those of last month showed significant increase of 273.2 percent in the households. However, stocks in commercial warehouses were down by 6.3 percent. There was no change in stocks held in NFA depositories from last month’s inventory.
- Against last year’s levels, stocks in the households dropped by 7.9 percent and in NFA depositories by 99.7 percent. On the other hand, stocks in commercial warehouses went up by 15.1 percent.
- Around 63 percent of the total corn stocks were with the households and 37 percent were with the commercial warehouses.
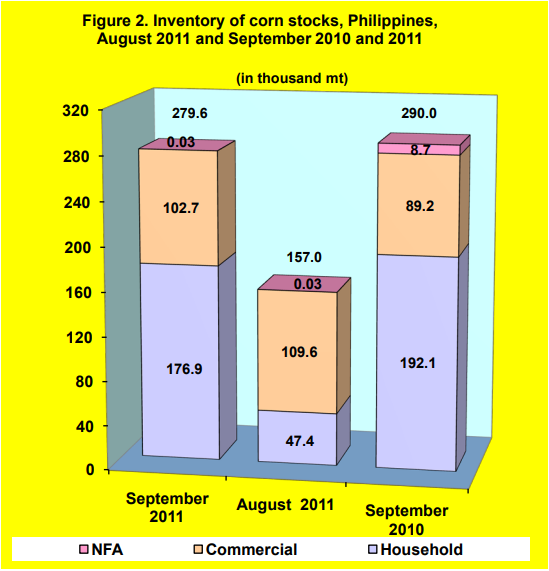
Table 2. Percentage change in the inventory of corn stocks,
Philippines, August 2011 and September 2010 and 2011
| Attachment | Size |
|---|---|
|
|
156.27 KB |