
Release Date :
RICE
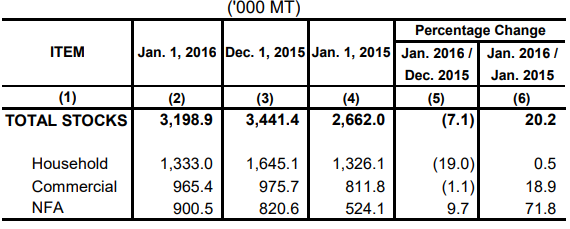
- The total rice stock inventory as of January 1, 2016 was 3.20 million metric tons (Figure 1). This was 20.2 percent above the 2.66 million metric tons level in January 2015 but 7.1 percent lower than last month’s inventory level of 3.44 million metric tons (Table 1).
- This month’s rice stocks in all sectors grew compared with their levels last year. Stocks in the households increased by 0.5 percent, in commercial warehouses by 18.9 percent, and in NFA depositories by 71.8 percent (Table 1).
- Compared with December 2015 levels, rice stocks in NFA depositories, which comprised 85.3 percent of imported rice, increased by 9.7 percent. On the other hand, stocks in the households and in commercial warehouses decreased by 19.0 percent and 1.1 percent, respectively (Table 1).
- Of this month’s total rice stock inventory, 41.7 percent were with the households, 30.2 percent were in commercial warehouses, and 28.1 percent in NFA depositories.
- The total rice inventory for this month would be sufficient for 93 days. Stocks in the households would be adequate for 39 days, those in commercial warehouses for 28 days, and those in NFA depositories for 26 days.
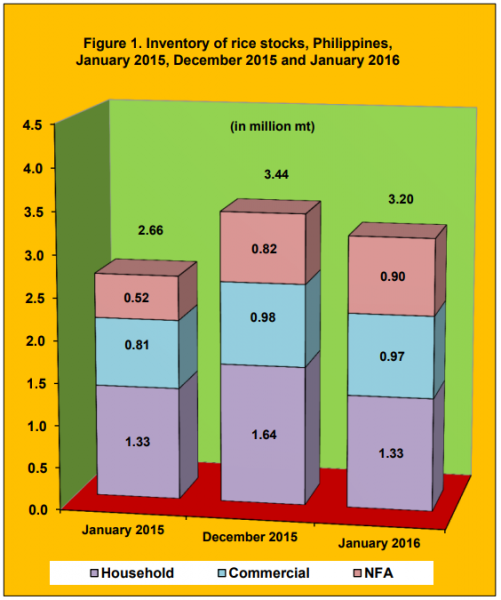
Table 1. Percentage change in the inventory of rice stocks, Philippines,
January 2015 and December 2015 and January 2016
CORN
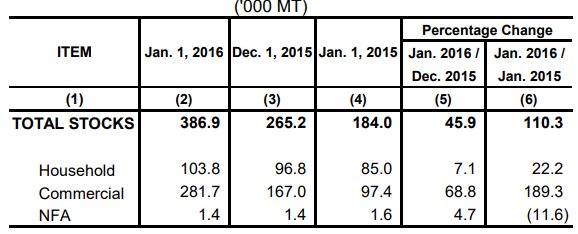
- As of January 1, 2016, the total corn stock inventory was 386.9 thousand metric tons (Figure 2). This was 110.3 percent higher than last year’s record of 184.0 thousand metric tons and 45.9 percent higher than last month’s level of 265.2 thousand metric tons (Table 2).
- Year-on-year, corn stocks in the households and in commercial warehouses increased by 22.2 percent and 189.3 percent, respectively. However, stocks in NFA depositories decreased by 11.6 percent (Table 2).
- Compared with December 2015 levels, corn stocks grew in all sectors. Stock levels in the households increased by 7.1 percent, in commercial warehouses by 68.8 percent, and in NFA depositories by 4.7 percent (Table 2).
- Around 72.8 percent of this month’s total corn stock inventory were in commercial warehouses, 26.8 percent were with the households, and 0.4 percent in NFA depositories.
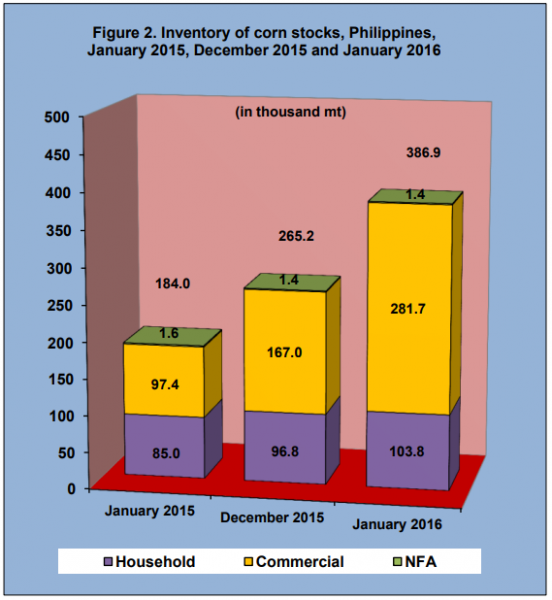
Table 2. Percentage change in the inventory of corn stocks, Philippines,
January 2015 and December 2015 and January 2016
| Attachment | Size |
|---|---|
|
|
325.84 KB |