
Release Date :
RICE STOCK
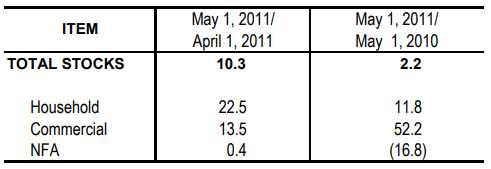
- The May 1, 2011 total rice stock inventory was 3.40 million metric tons (Figure 1). This was 10.3 percent higher than the previous month’s record of 3.08 million metric tons and 2.2 percent more than last year’s inventory of 3.32 million metric tons (Table 1).
- Comparative estimates with those of last month showed significant increases in all sectors’ inventories. Stocks in the households were higher by 22.5 percent, while those in the commercial sector grew by 13.5 percent. The volume of stocks in NFA depositories, of which 70 percent were imported rice, slightly went up by 0.4 percent.
- Compared to last year’s records, stocks in the households went up by 11.8 percent while those in the commercial warehouses increased by 52.2 percent. In contrast, stocks in NFA depositories dropped by 16.8 percent.
- The May 1, 2011 inventory of rice stocks would be enough for 100 days. Stocks in NFA depositories would be good for 43 days, while those in commercial warehouses would be good for 21 days. Household stocks would last for 36 days.
- Of the current stock level, about 36 percent were with the households, 21 percent were with the commercial warehouses and 43 percent were with the NFA depositories.
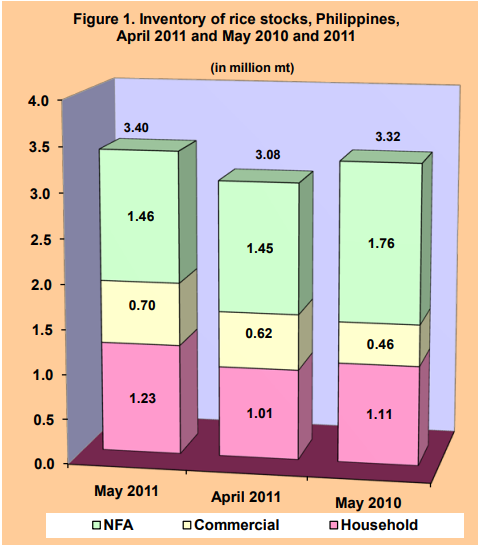
Table 1. Percentage change in the inventory of rice stocks,
Philippines, April 2011 and May 2010 and 2011
CORN STOCK
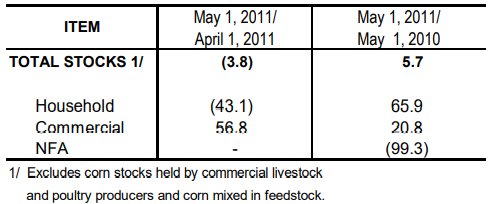
- The total corn stock as of May 1, 2011 was 206.2 thousand metric tons (Figure 2). This was 3.8 percent lower than last month’s level of 214.4 thousand metric tons, but 5.7 percent more than last year’s record of 195.0 thousand metric tons (Table 2).
- Compared to last month’s levels, stock position in the households dropped by 43.1 percent. On the other hand, stocks in commercial warehouses went up by 56.8 percent. Stocks in NFA depositories recorded no change from last month’s inventory.
- Relative to last year’s levels, stocks in the households were higher by 65.9 percent and those in commercial warehouses by 20.8 percent. In contrast, stocks in NFA depositories dropped by 99.3 percent.
- Of the current stock level, about 64.0 percent were with the commercial warehouses, and 35.9 percent were with the households. NFA stocks accounted for 0.1 percent.
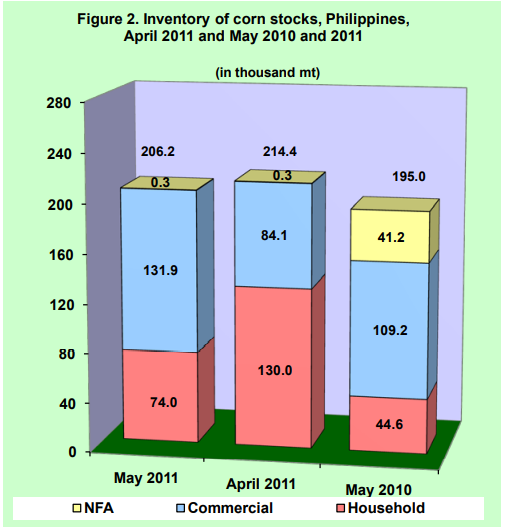
Table 2. Percentage change in the inventory of corn stocks,
Philippines, April 2011 and May 2010 and 2011
| Attachment | Size |
|---|---|
|
|
120.95 KB |