
RICE
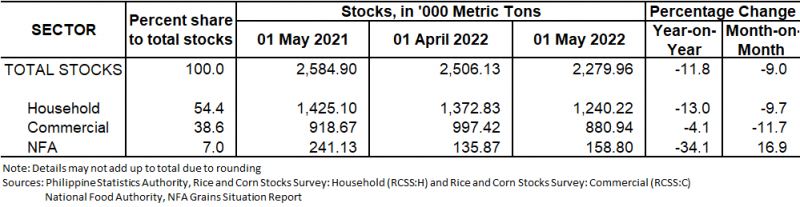
The total rice stocks inventory as of
Moreover, the
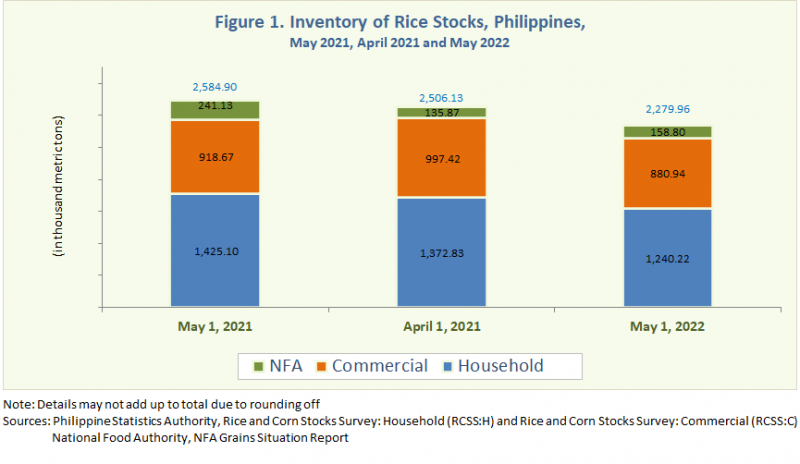
This month's stocks inventory levels in all sectors were lower than the
Compared with the previous month's inventory level, this month's rice stocks fell by
Of the current rice stocks level, about
Table 1. Level and Percent Change of Rice Stocks by Sector: Philippines
May 2021, April 2022, and May 2022
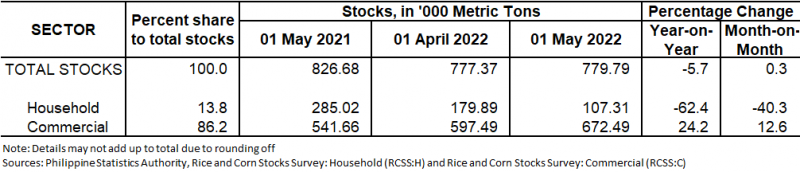
CORN
As of
On the other hand, the
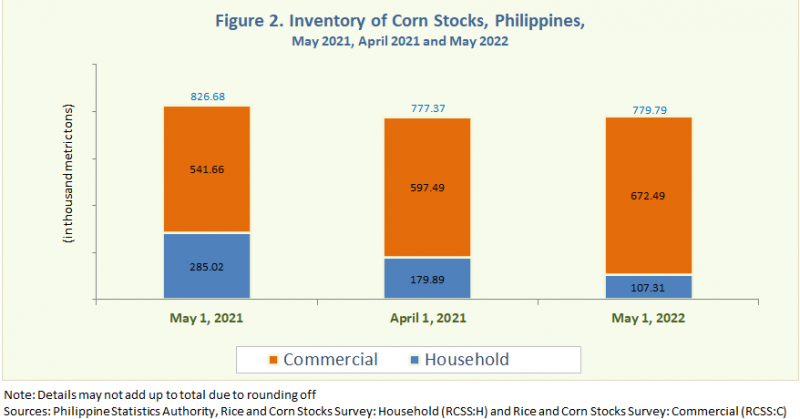
In reference to the
The corn stocks inventory levels showed an increase of
Of this month's total corn stocks, around
Table 2. Level and Percent Change of Corn Stocks by Sector: Philippines
May 2021, April 2022, and May 2022
DENNIS S. MAPA, Ph.D.
Undersecretary
National Statistician and Civil Registrar General
TECHNICAL NOTES
Monthly rice and corn stocks inventory are generated from three sectors, namely: household, commercial, and government (National Food Authority). The household and commercial stocks are taken from the results of Rice and Corn Stocks Survey: Household (RCSS:H) and Rice and Corn Stocks Survey: Commercial (RCSS:C) of the Philippine Statistics Authority (PSA). The RCSS:H and RCSS:C were formerly known as Palay and Corn Stocks Survey (PCSS) and Commercial Stocks Survey (CSS), respectively. These surveys were renamed as per PSA Board Resolution No. 02 Series of 2021 on Approving and Adopting the Modifications in the System of Designated Statistics dated 11 May 2021. The renaming of the designated statistical activity, from Palay/Rice and Corn Stocks Surveys to Rice and Corn Stocks Surveys, was done to provide a generic name for both household and commercial stocks surveys and differentiate the commercial stocks inventory from that in the household sector.
The RCSS:H covers sample farming households and non-farming households nationwide. Sample farming households are sub-sample of Palay Production Survey (PPS) and Corn Production Survey (CPS). In these surveys, the primary sampling units (PSUs) are the palay/corn producing barangays and secondary sampling units (SSUs) are the palay/corn farming households. The PSUs are selected using probability proportional to size, while the SSUs are selected through systematic sampling. For the non-farming households, five non-farming households are selected for each barangay.
The RCSS:C employs a two-stage systematic sampling wherein the first level of stratification is the line of activity of the NFA registered grains businessmen and the second level of stratification is the businessmen’s capitalization. The line of activity of grains businessmen are stratified into four:
| Attachment | Size |
|---|---|
|
|
398.09 KB |