
Release Date :
RICE
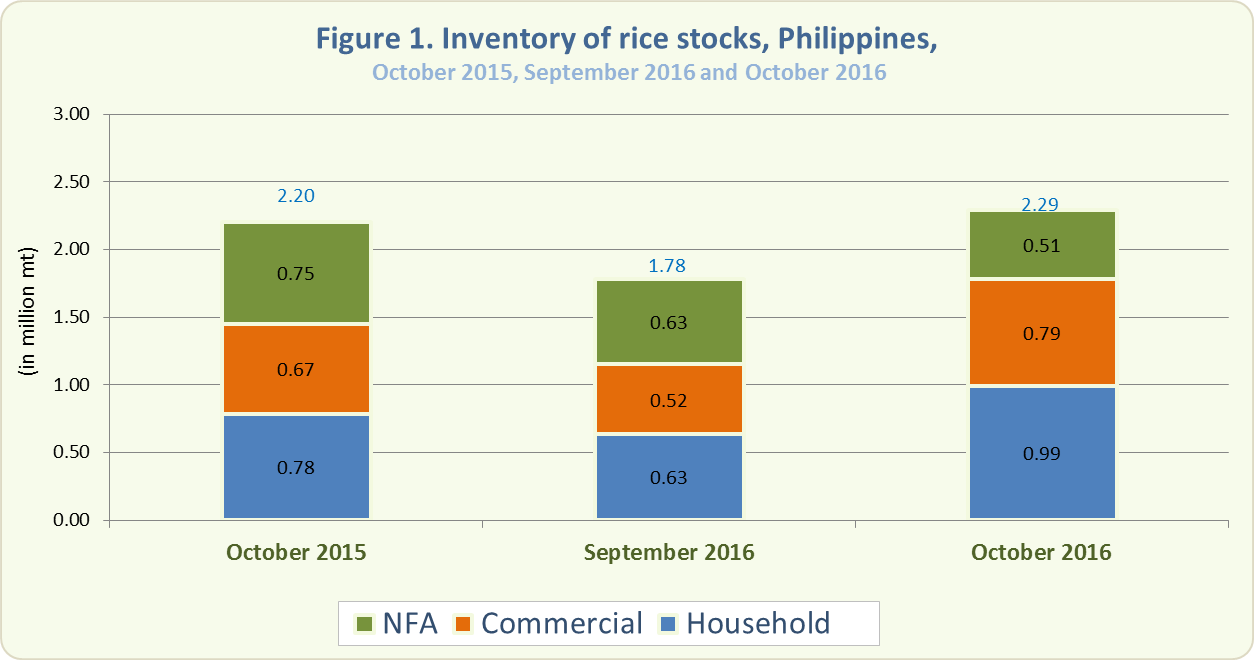
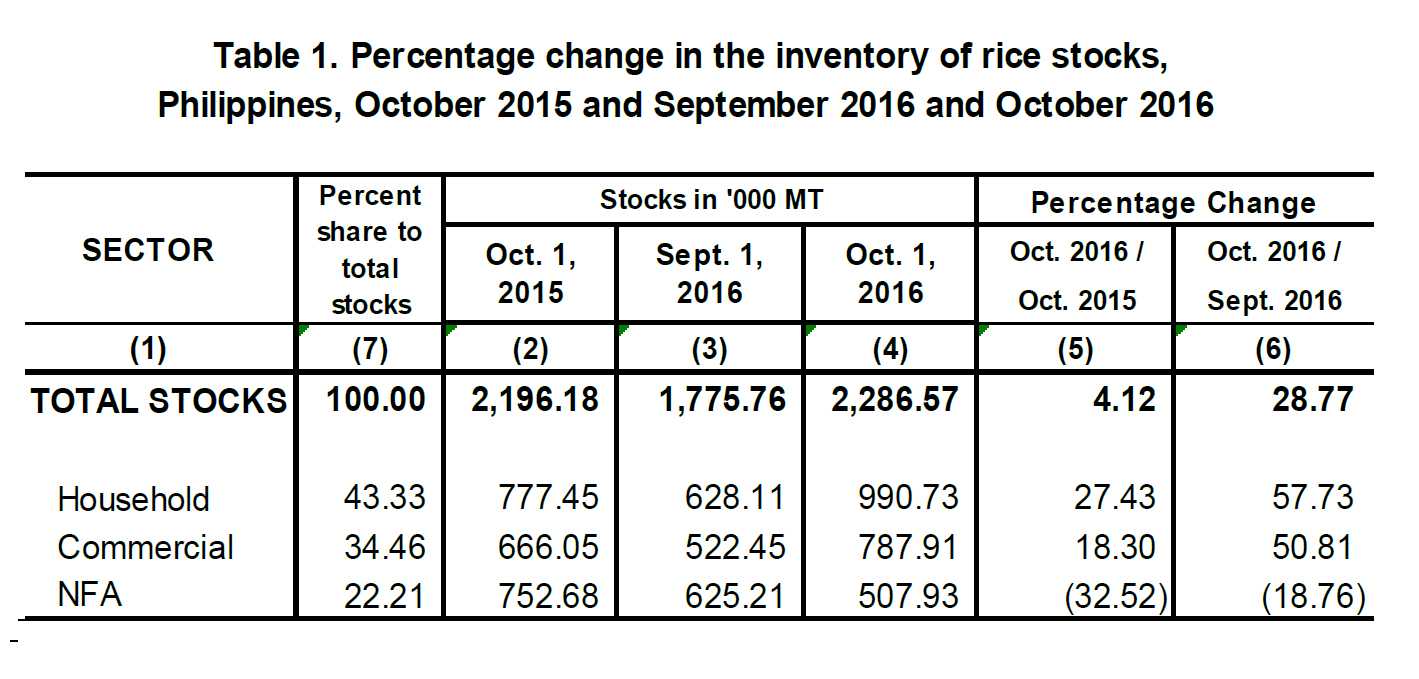
- As of October 1, 2016, the total rice stock inventory was 2.29 million metric tons (Figure 1). This was 4.12 percent higher than the 2.20 million metric tons level in October 2015 and 28.77 percent higher than last month’s inventory level of 1.78 million metric tons (Table 1).
- Compared with last year, rice stocks in the households and in commercial warehouses increased by 27.43 percent and 18.30 percent, respectively. On the other hand, stocks in NFA depositories decreased by 32.52 percent (Table 1).
- Compared with their levels last month, rice stocks in the households and in commercial warehouses grew by 57.73 percent and 50.81 percent, respectively. However, stocks in NFA depositories dropped by 18.76 percent (Table 1).
- Of this month’s total rice stock inventory, 43.33 percent were with the households, 34.46 percent were in commercial warehouses, and 22.21 percent were in NFA depositories. The latter comprised 77.49 percent of imported rice.
- The total rice inventory for this month would be sufficient for 67 days. Stocks in the households would be enough for 29 days, those in commercial warehouses for 23 days, and those in NFA depositories for 15 days.
CORN
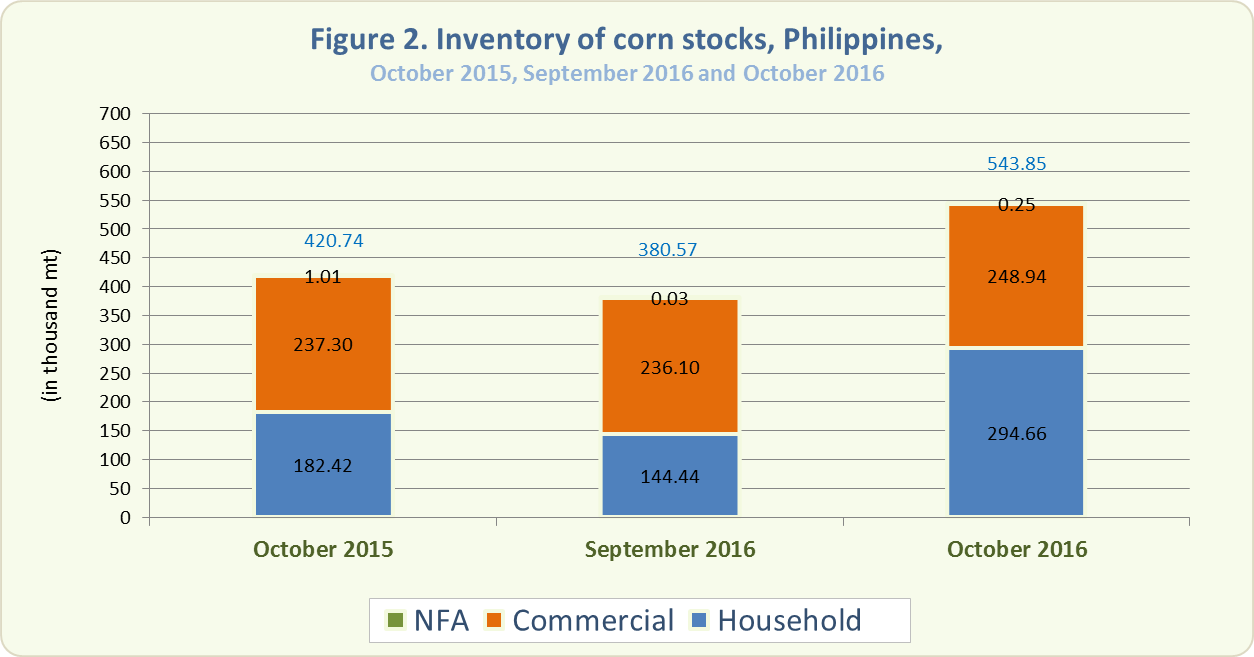
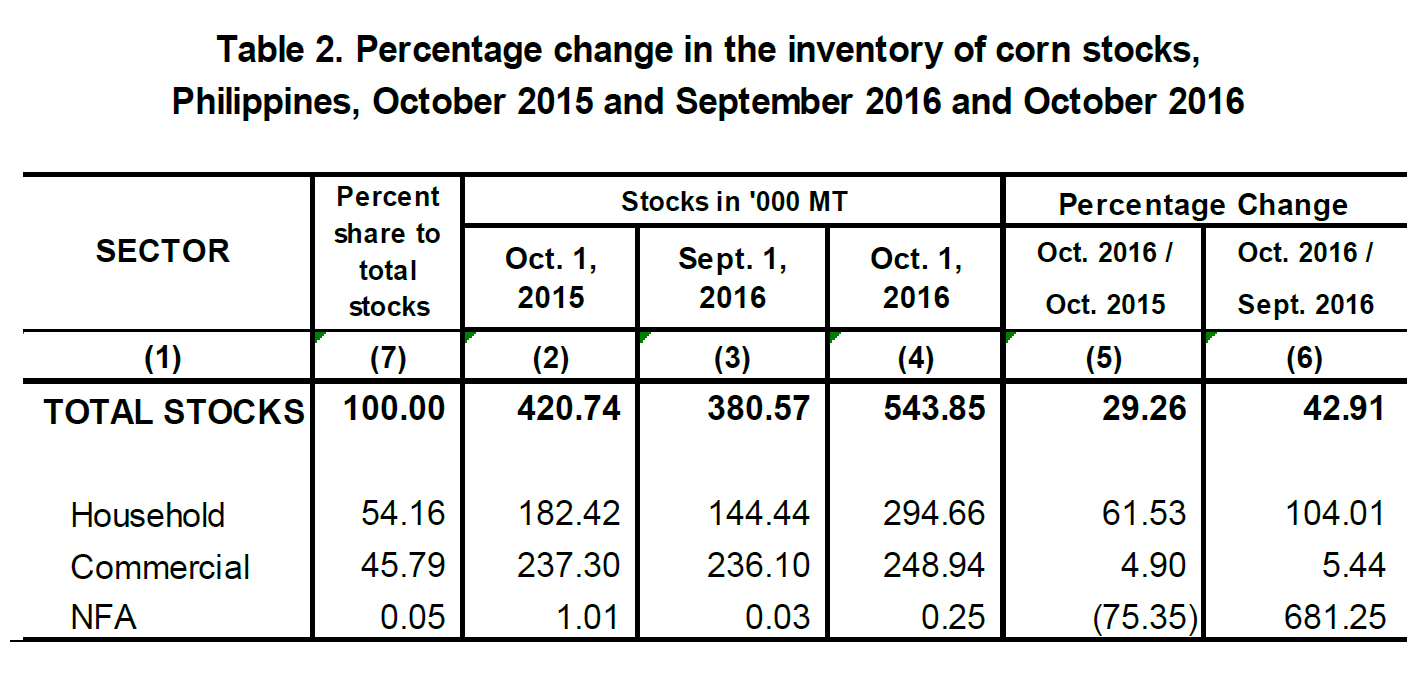
- The total corn stock inventory as of October 1, 2016, was 543.85 thousand metric tons (Figure 2). This was 29.26 percent higher than last year’s record of 420.74 thousand metric tons and 42.91 percent higher than last month’s level of 380.57 thousand metric tons (Table 2).
- Year-on-year, corn stocks in the households and in commercial warehouses increased by 61.53 percent and 4.90 percent, respectively. However, stocks in NFA depositories decreased by 75.35 percent (Table 2).
- This month’s corn stocks in all sectors grew compared with their levels last month. Stocks in the households increased by 104.01 percent, in commercial warehouses by 5.44 percent, and in NFA depositories by 681.25 percent (Table 2).
- Around 54.16 percent of this month’s total corn stock inventory were with the households, 45.79 percent were in commercial warehouses, and 0.05 percent in NFA depositories.
Technical Notes
Monthly rice and corn stocks inventory are generated from three sectors, namely: household, commercial, and National Food Authority (NFA). The household stocks are taken from the Palay and Corn Stocks Survey (PCSS1) of the PSA, which covers farming and non-farming households nationwide. The commercial stocks are sourced from registered grains businessmen through the Commercial Stocks Survey (CSS), conducted by the NFA, the results of which are submitted to PSA. NFA stocks are monitored from their warehouses/depositories.
| Attachment | Size |
|---|---|
|
|
440.69 KB |