Population increased at the rate of 1.10 percent annually
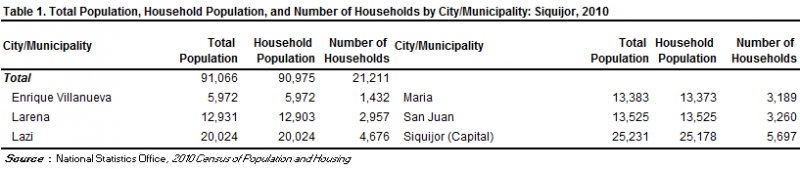
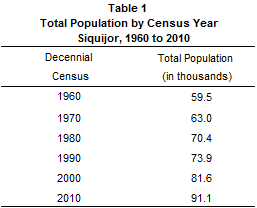
Based on the 2010 Census of Population and Housing (CPH), the province of Siquijor posted a total population of 91,066 persons as of May 1,2010. This is larger by 9,468 persons compared to its total population of 81,598 persons counted in the 2000 CPH. The increase in the population count from 2000 to 2010 translated to an average annual population growth rate (PGR) of 1.10 percent. This is higher than the 0.99 percent annual PGR of the province between the census years 1990 and 2000.
If the average annual PGR recorded at 1.10 percent during the period 2000 to 2010 continues, the population of Siquijor would double in 63 years.
Fifty years ago, the population of Siquijor was only 59,555 persons. This population size is about two thirds of the population of the province in the 2010 CPH.
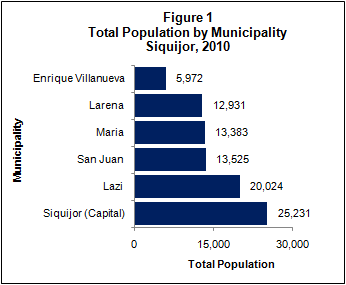
Municipality of Siquijor was the most populous
Among the six municipalities comprising the province of Siquijor, the municipality of Siquijor, the provincial capital, was the most populous with a population size making up 27.7 percent of the total provincial population. The municipality of Lazi was second with 22.0 percent share, followed by the municipalities of San Juan (14.9 percent), Maria (14.7 percent), Larena (14.2 percent), and Enrique Villanueva (6.6 percent).
The municipality of Enrique Villanueva was also the least populated area in 2000.
Sex ratio increased to 102 males per 100 females
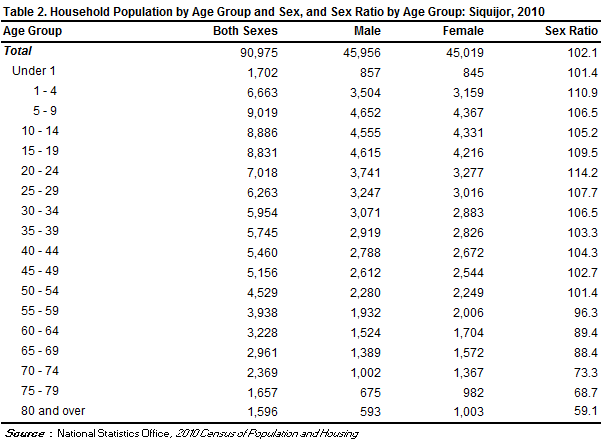
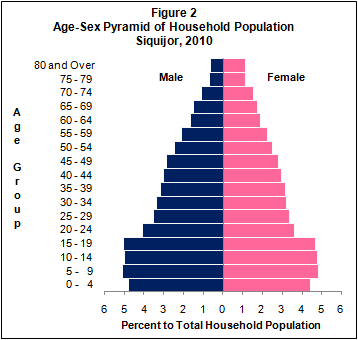
Of the 90,975 household population in 2010, males accounted for 50.5 percent while females comprised 49.5 percent. These figures resulted in a sex ratio of 102 males for every 100 females. In 2000, the sex ratio recorded was 100 males per 100 females.
Median age increased to 27.7 years
In 2010, the median age of the population of the province was 27.7 years, which means that half of the population was younger than 27.0 years. This is higher than the median age of 25.0 years that was recorded in 2000.
Moreover, 28.9 percent of the household population were under 15 years old. Children aged 5 to 9 years (9.9 percent) comprised the largest age group, followed by those in the age groups 10 to 14 years (9.8 percent) and 15 to 19 years (9.7 percent). Males outnumbered females in the age groups 0 to 54 years. On the other hand, there were more females than males in the older age groups (55 years and over).
More than half of the population were of voting age
The voting-age population (18 years and over) accounted for 65.2 percent of the household population of the province in 2010, up from 61.2 percent in 2000. There were more females (50.1 percent) than males (49.9 percent) among the voting-age population.
Dependency ratio decreased to 62 dependents per 100 persons in the working age group
In 2010, the young dependents (0 to 14 years) comprised 28.9 percent of the household population while the old dependents (65 years and over) posted a share of 9.4 percent. The working-age population (15 to 64 years) accounted for the remaining 61.7 percent.
The overall dependency ratio was 62, which indicates that for every 100 working-age population, there were about 62 dependents (47 young dependents and 15 old dependents). This ratio is lower than the dependency ratio in 2000, which was recorded at 69 dependents per 100 working-age population (55 young dependents and 14 old dependents).
There were more males than females among the never-married persons
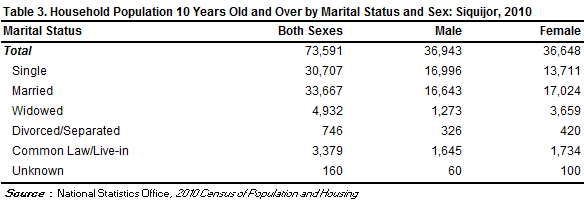
Of the household population 10 years old and over, 45.7 percent were married while 41.7 percent were never married. The rest of the population were categorized as follows: widowed (6.7 percent), in common-law/live-in marital arrangement (4.6 percent), and divorced/separated (1.0 percent).
Among the never-married persons, 55.3 percent were males while 44.7 percent were females. For the rest of the categories for marital status, the females outnumbered the males.
More females had attained higher levels of education
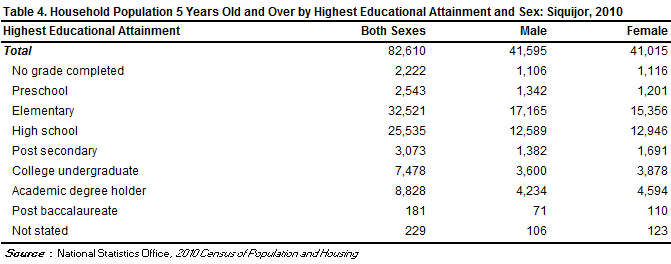
Of the household population aged five years and over, 39.4 percent had attended or completed elementary education, 30.9 percent had reached or finished high school, 9.1 percent were college undergraduates, and 10.7 percent were academic degree holders. Among those with an academic degree, the females (52.0 percent) outnumbered the males (48.0 percent). Similarly, more females (60.8 percent) than males (39.2 percent) had pursued post baccalaureate courses.
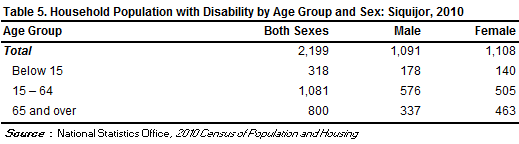
Persons with disability comprised 2.4 percent of the population in the province
In 2010, around 2,200 persons or 2.4 percent of the 90,975 household population had a disability. This proportion of persons with disability (PWD) is higher than the proportion in 2000, which was 1.9 percent of the 81,517 household population of the province during that year. The number of PWD for the same year was around 1,600.
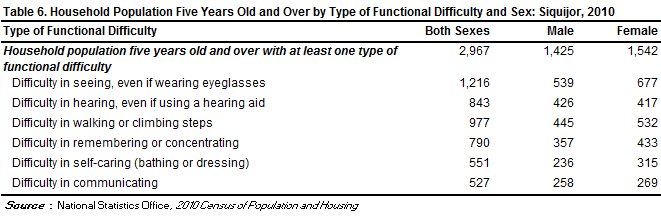
There were more females than males among those with functional difficulty
Of the 82,610 household population five years and over, 3.6 percent (or 2,967 persons) had at least one type of functional difficulty either in seeing, hearing, walking or climbing steps, remembering or concentrating, self-caring (bathing or dressing), or communicating. There were more females (52.0 percent) than males (48.0 percent) among those persons with at least one type of functional difficulty.
Moreover, of the total 2,967 persons aged five years and over with at least one type of functional difficulty, 41.0 percent reported difficulty in seeing, even if wearing eyeglasses. There were 32.9 percent who had difficulty in walking or climbing steps, 28.4 percent had difficulty in hearing, even if using a hearing aid, 26.6 percent had difficulty in remembering or concentrating, 17.8 percent had difficulty in communicating, and 18.6 percent had difficulty in self-caring (bathing or dressing).
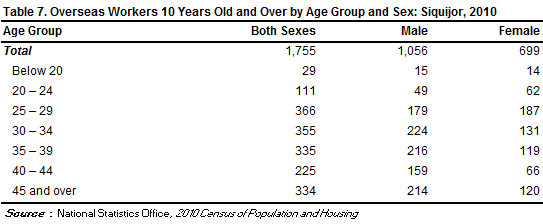
Male overseas workers outnumbered their female counterparts
Of the 73,591 household population 10 years old and over in Siquijor, 2.4 percent (or 1,755 persons) were overseas workers. Male overseas workers outnumbered their female counterparts as they comprised 60.2 percent of all the overseas workers from this province. Overseas workers aged 25 to 29 years made up the largest age group, comprising 20.9 percent of the total overseas workers from this province in 2010, followed by the age groups 30 to 34 years (20.2 percent), 35 to 39 years (19.1 percent), and 45 years and over (19.0 percent).
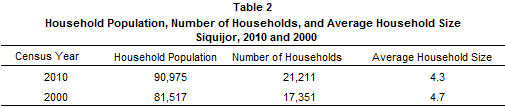
Average household size was 4.3 persons
The number of households in 2010 was recorded at 21,211, higher by 3,860 households compared with the 17,351 households posted in 2000. The average household size in 2010 was 4.3 persons, lower than the average household size of 4.7 persons in 2000.
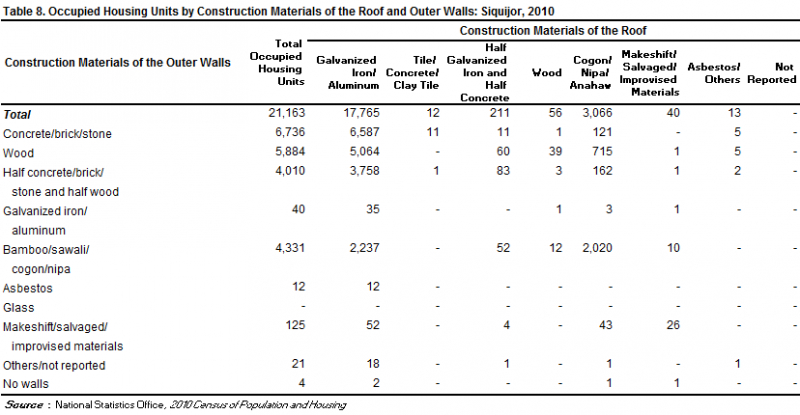
There were 100 households per 100 occupied housing units
A total of 21,163 occupied housing units were recorded in the province of Siquijor in 2010. This translates to a ratio of 100 households for every 100 occupied housing units, with 4.3 persons per occupied housing unit. In 2000, there were 101 households per 100 occupied housing units, and 4.7 persons per occupied housing unit.
Occupied housing units with outer walls and roofs made of strong materials increased
In 2010, 27.8 percent of the occupied housing units in the province had outer walls made of wood, down from 33.0 percent in 2000. The proportion of occupied housing units with outer walls made of concrete/brick/stone, on the other hand, increased from 15.7 percent in 2000 to 31.8 percent in 2010. Meanwhile, 83.9 percent of the occupied housing units in 2010 had roofs made of galvanized iron/aluminum. This is higher than the proportion recorded in 2000 at 72.1 percent.
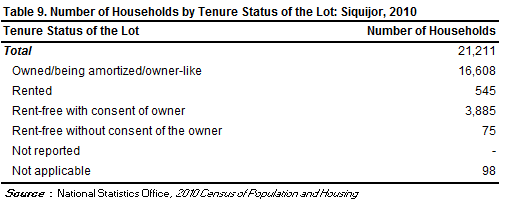
Majority of the households lived in lots that they owned or amortized
In 2010, of the total 21,211 households in 2010, 78.3 percent owned or amortized the lots that they occupied. The corresponding figure in 2000 was 73.5 percent.
Moreover, 18.3 percent of the households occupied lots which were rent-free but with consent of the owner, 2.6 percent rented the lots that they occupied while 0.4 percent occupied lots which were rent-free but without consent of the owner.
(Sgd) CARMELITA N. ERICTA
Administrator