
| Year-on-Year Inflation Rates, All Items | ||||
|---|---|---|---|---|
| May 2014 | April 2014 | May 2013 | Year-to-date | |
| Philippines | ||||
| Headline | 4.5 | 4.1 | 2.6 | 4.1 |
| Core | 3.1 | 2.9 | 3.0 | 3.0 |
| NCR | ||||
| Headline | 3.8 | 3.3 | 1.8 | 3.1 |
| AONCR | ||||
| Headline | 4.7 | 4.4r | 2.9 | 4.5 |
r - revised
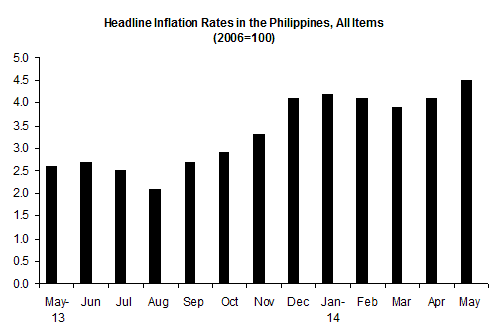
The annual headline inflation in the Philippines increased to 4.5 percent in May. It was recorded at 4.1 percent last month and 2.6 percent in the same period last year. The growth was primarily brought about by higher annual rate posted in the heavily-weighted food and non-alcoholic beverages index. Faster annual increments were also registered in the indices of clothing and footwear; housing, water, electricity, gas and other fuels; furnishing, household equipment and routine maintenance of the house; transport; and communication.
Excluding selected food and energy items, core inflation escalated 3.1 percent in May 2014, faster than the 2.9 percent growth in April 2014 and 3.0 percent in the same month last year.
Similarly, annual inflation in the National Capital Region (NCR) rose 3.8 percent in May. It was pegged at 3.3 percent last month and 1.8 percent in May 2013. Contributing to the uptrend were higher annual gains observed in the indices of food and non-alcoholic beverages; clothing and footwear; housing, water, electricity, gas and other fuels; and health.
Annual inflation in Areas Outside NCR (AONCR) was at 4.7 percent in May 2014. In April, it rose to 4.4 percent and in the same period last year, 2.9 percent. The indices of six out of the 11 commodity divisions had higher annual rates during the month.
| Year-on-Year Inflation Rates in the Philippines, All Items January 2009 - May 2014 (2006=100) | ||||||
|---|---|---|---|---|---|---|
Month | Year | |||||
| 2009 | 2010 | 2011 | 2012 | 2013 | 2014 | |
| January | 7.1 | 3.9 | 4.0 | 4.0 | 3.1 | 4.2 |
| February | 7.2 | 3.9 | 4.7 | 2.7 | 3.4 | 4.1 |
| March | 6.7 | 3.9 | 4.9 | 2.6 | 3.2 | 3.9 |
| April | 5.6 | 4.0 | 4.7 | 3.0 | 2.6 | 4.1 |
| May | 4.3 | 3.9 | 4.9 | 3.0 | 2.6 | 4.5 |
| June | 3.2 | 3.6 | 5.2 | 2.9 | 2.7 | |
| July | 2.2 | 3.7 | 4.9 | 3.2 | 2.5 | |
| August | 1.7 | 4.1 | 4.6 | 3.8 | 2.1 | |
| September | 2.3 | 3.8 | 4.7 | 3.7 | 2.7 | |
| October | 2.9 | 3.3 | 5.2 | 3.2 | 2.9 | |
| November | 3.5 | 3.7 | 4.7 | 2.8 | 3.3 | |
| December | 4.4 | 3.6 | 4.2 | 3.0 | 4.1 | |
| Average | 4.2 | 3.8 | 4.6 | 3.2 | 3.0 | |
| Month-on-Month Inflation Rates, All Items (2006=100) | ||
|---|---|---|
| May 2014 | April 2014 | |
| Philippines | 0.5 | 0.4 |
| NCR | 0.5 | 0.5 |
| AONCR | 0.5 | 0.4 |
Prices of consumer items in the Philippines picked up 0.5 percent in May. This was mainly due to higher prices in food items particularly rice, corn, vegetables, fresh meat, ginger, sugar and sugar products, milk, cheese and eggs. Higher charges in electricity rates and price hikes in selected construction materials and clothing and footwear items were also noticed in many regions.
CONSUMER PRICE INDEX
(2006=100)
MAY 2014
By Region, Year-on-Year
- Year-on-year inflation in NCR accelerated to 3.8 percent in May 2014.
Similarly, price gain in AONCR was noted at 4.7 percent in May. Higher annual increments were registered in all the regions except in Northern Mindanao. The highest annual inflation of 7.6 percent remained in Eastern Visayas while the lowest was in Davao at 3.6 percent.
By Commodity Group, Year-on-Year
At the national level, year-on-year mark-ups in the indices of the following commodity groups were on the uptrend: food and non-alcoholic beverages (6.7%); clothing and footwear (3.4%); housing, water, electricity, gas and other fuels (3.7%); furnishing, household equipment and routine maintenance of the house (2.5%); transport (1.5%); and communication (0.1%). The rest of the commodity groups either had slower annual growths or retained their last month’s rate.
On annual basis, the country’s food alone index went up 7.1 percent in May 2014. It was posted at 6.5 percent last month and 1.9 percent in the same period a year ago.
All the food groups had higher annual increases.
In NCR, annual inflation of the heavily-weighted food and non-alcoholic beverages index advanced 6.5 percent; clothing and footwear index, 3.3 percent; housing, water, electricity, gas and other fuels index, 3.2 percent; and health index, 4.2 percent. Those for the rest of the commodity groups either decelerated or remained at their last month’s rates.
Annual adjustment in the food alone index in NCR climbed 6.9 percent in May. Its annual inflation last month was 5.7 percent and in May 2013, 1.6 percent.
A double-digit annual rate of 16.2 percent was noted in rice and food products not elsewhere classified indices. Faster annual growths were also noted in all the other food groups except in corn and oils and fats indices. The annual increase of the corn index slowed to 2.3 percent while that for the oils and fats index dropped by 2.9 percent.
The annual adjustment in food and non-alcoholic beverages index in AONCR was recorded at 6.8 percent in May; clothing and footwear index, 3.5 percent; housing, water, electricity, gas and other fuels index, 3.9 percent; furnishing, household equipment and routine maintenance of the house index, 2.3 percent; transport index, 1.5 percent; and communication index, 0.1 percent. The other commodity groups either retained their last month’s rate or had slower annual growths.
The food alone index in AONCR gained 7.1 percent in May. Its annual inflation was 6.6 percent last month and 2.0 percent in the same period last year.
The annual change in the rice index moved up 12.5 percent in May as all the regions except Cagayan Valley, Eastern Visayas and Northern Mindanao had higher annual growths. The highest annual inflation of 17.7 percent was noticed in Bicol while the lowest rate was in Davao at 3.9 percent.
All the other food groups had higher annual increments except for the vegetable index whose rate remained at 8.7 percent.
By Region, Month-on-Month
The month-on-month inflation in NCR picked up by 0.5 percent in May due to the 1.3 percent mark-up in food and non-alcoholic beverages index. The other commodity groups either had slower monthly growths or retained their last month’s rate with the transport index posting a 0.1 percent decrease during the month.
Prices of consumer items in AONCR moved up by 0.5 percent in May. Higher monthly upticks were noted in the indices of alcoholic beverages and tobacco at 0.3 percent in May; clothing and footwear, 0.4 percent; housing water, electricity, gas and other fuels, 0.9 percent; furnishing, household equipment and routine maintenance of the house, 0.2 percent; and transport and recreation and culture, 0.1 percent. Movement in the other commodity groups either slowed down or remained at their last month’s rate.
Price add-ons were higher in 13 regions with the highest monthly rate of 1.6 percent registered in SOCCSKSARGEN.
Among the three big areas of the country, price mark-ups were generally faster in Mindanao compared to Luzon and Visayas areas.
By Commodity Group, Month-on-Month
Measured from a month ago level, prices of consumer items in the Philippines grew by 0.5 percent in May. This was brought about by the 0.7 percent increase in the heavily-weighted food and non-alcoholic beverages index. In addition, higher growth rates were seen in alcoholic beverages and tobacco and clothing and footwear indices at 0.3 percent and in furnishing, household equipment and routine maintenance of house index, 0.2 percent. The rest of the commodity groups either slowed down or retained their last month's rate. The indices of transport, communication and education still registered a zero growth.
Higher monthly price gains in the rice index were noted in seven regions with MIMAROPA recording the highest monthly rate of 2.3 percent. Thus, the group's index in AONCR picked up 0.8 percent in May. In NCR, the index of rice likewise moved upward at 2.6 percent. At the national level, the group's index jumped by 1.0 percent.
The continued limited supplies of ginger thereby raising its prices in the markets mainly contributed to growths in the food products not elsewhere classified index at 3.2 percent in the Philippines; 6.5 percent in NCR; and 2.5 percent in AONCR. Upward price adjustments in selected spices, condiments and seasonings were also observed during the month.
Lower supplies of live hogs along with bigger demand for meat due to “fiesta” celebrations in May pushed up prices of pork during the month. Prices of beef, chicken and other meat products also went up in many regions. Thus, the index for meat in the Philippines advanced by 1.0 percent; NCR, 1.5 percent; and AONCR, 0.8 percent.
The national index for sugar, jam, honey, chocolate and confectionery escalated by 1.3 percent; NCR, 0.3 percent; and AONCR, 1.5 percent as prices of sugar were on the uptrend.
Low volume of catch of selected marine fish species during the month limited its supplies in the NCR markets. It triggered higher prices of fish in the area. Hence, the fish index in NCR gained 0.8 percent. In AONCR, lower prices of selected fish species in some regions pushed down its group’s index by 0.1 percent. These offsetting price movements resulted to a zero growth in the national index.
The corn index in AONCR and in the Philippines registered growth rates of 1.2 percent and 1.1 percent, respectively as prices of corn further moved up in selected regions. On the other hand, prices of corn in NCR went down as its index dropped by 1.1 percent.
Price increments in milk, cheese and eggs in many regions resulted to 0.4 percent uptick in the group’s index in AONCR; 0.1 percent in NCR; and 0.3 percent in the Philippines.
The extreme heat felt during the month caused high spoilage of some vegetables in the markets. It triggered higher prices of vegetables such as cabbage, garlic, tomatoes, carrot and pechay. Thus, the vegetables index in NCR accelerated by 2.9 in May and in AONCR, 0.3 percent. At the national level, the group’s index grew by 0.7 percent.
The index for housing, water, electricity, gas and other fuels in AONCR moved up by 0.9 percent due to higher charges in electricity rates and increased prices of selected construction materials. Upward adjustments in the salaries of carpenters, electricians and painters were also noted in selected regions. Likewise, the group’s index in NCR rose 0.3 percent as prices of selected construction materials and kerosene went up during the month. In the Philippines, the group’s index climbed by 0.7 percent.
Prices of some items for personal care and effects generally went up during the month. This factor resulted to a 0.1 percent growth in the index for restaurant and miscellaneous goods and services in the three areas.
Price hikes in clothing and footwear items observed during the month pushed up the group’s index in the three areas: Philippines, 0.3 percent; NCR, 0.1 percent; and AONCR, 0.4 percent.
Notes:
- Revision in the inflation rate in AONCR for April 2014 was due to the updated reports in electricity rates from selected provinces.
- CPIs and inflation rates by province and selected city are also available upon request at NSO, Industry and Trade Statistics Department, Economic Indices and Indicators Division (Telephone Numbers: 716-39-35 and 715-33-47).
(Sgd.) LISA GRACE S. BERSALES, Ph.D.
National Statistician