
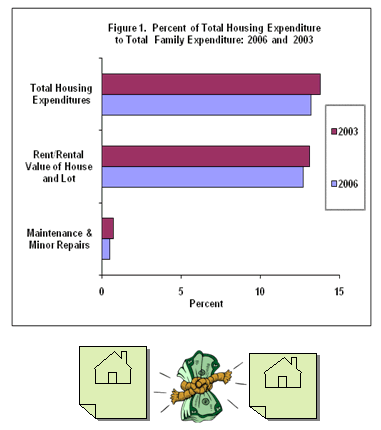
Total housing expenditure increase in 2006
Total housing expenditure in 2006 was estimated at P340.6 billion indicating an increase of 21.3 percent over the 2003 estimate of P280.8 billion.
Of the P340.6 billion reported housing expenditure, 12.7 percent went to rent/rental value of house and lot, while only 0.5 percent was spent on house maintenance and minor repairs.
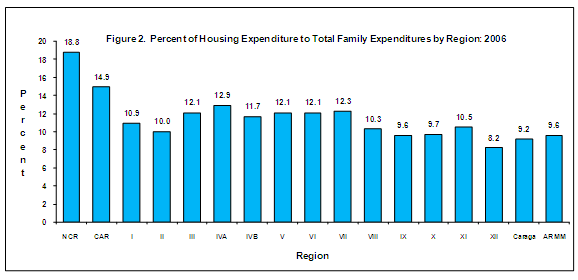
NCR and CAR reported the highest proportion of housing expenditure
NCR and CAR reported the highest proportion of housing expenditure to total family expenditure with 18.8 percent and 14.9 percent respectively. The national estimate was reported at 13.3 percent. On the other hand, Region XII reported the least proportion of housing expenditure with 8.2 percent.
Tenth decile families show decrease in proportion of housing expenditure
Tenth decile families or the richest ten percent reported the highest proportion of housing expenditure to total family expenditure with 15.4 percent. There was a decrease of 1.1 percentage points from 2003 figure of 16.5 percent. On the other hand, families in the first and second decile reported the least proportion of housing expenditure to total family expenditure with both 9.4 percent.
The gap in the housing expenditure between families in the tenth decile income group and first decile income group decreased in 2006, from 24 times that of the first decile in 2003 to 21 times in 2006.

TECHNICAL NOTES
The 2006 Family Income and Expenditure Survey (FIES) is a nationwide survey of households undertaken every three years by the National Statistics Office (NSO). It is the main source of data on family income and expenditure, which include among others, levels of consumption by item of expenditure as well as sources of income in cash and in kind. The results of FIES provide information on the levels of living and disparities in income of Filipino families, as well as their spending patterns.
The 2006 FIES is a sample survey designed to provide income and expenditure data that are representative of the country and its 17 regions. It used four replicates of the 2003 Master Sample (MS) created for household surveys on the basis of the 2000 Census of Population and Housing. The 2003 MS has been designed to produce the sample size needed for large surveys, like the FIES. To facilitate subsampling, the 2003 MS has been designed to readily produce four replicate samples from the full set of sampled PSUs.
In the 2003 MS, a stratified, three-stage sampling design was employed: the selection of Primary Sampling Units (PSUs) for the first stage, sample enumeration areas (EAs) for the second stage, and sampling units for the third stage. The domains are the regions which were stratified by province, highly urbanized city (HUC), independent component city (ICC), and other factors within the geographical strata. The overall sampling fractions vary across regions to generate adequate sample size for each region. Survey weights are used in order to produce valid estimates of the population parameter. Base weights are computed to compensate for the unequal selection probabilities in the sample design. These were adjusted to account for unit nonresponse and to conform to known population distributions (eg. projected population counts).
The 2006 FIES enumeration was conducted twice - the first visit was done in July 2006 with the first semester January to June as the reference period; the second visit was made in January 2007 with the second semester of 2006, that is, July to December 2006 as reference period. The same set of questions is asked for both visits.
The number of households/families for the 2006 FIES was estimated using the 2000 Census of Population and Housing (CPH)-based population projections and information from the 2000 CPH on the average household size by province.
The estimates from the 2006 FIES include results of the first FIES visit for the NCR based on the questionnaires recovered from the fire that hit the NCR�s Statistics Office on October 3, 2006. Damaged questionnaires were around 58 percent of the total questionnaires for the FIES first visit. Questionnaires that were encoded and processed covered around 42 percent of these questionnaires. In the preliminary results, values for the burned questionnaires were imputed using a ratio which requires data from the recovered questionnaires and data from corresponding questionnaires from the second visit. The ratio was computed by getting the sums of the total income and total expenditure in the recovered questionnaires from the first visit and the sums of the same data from corresponding second visit questionnaires and then by dividing the sums from the second visit by the sums from the first visit. The annual estimates on income and expenditure for NCR were computed by dividing the second visit values by the computed ratio. For the final results, the annual estimates for the NCR were computed by multiplying by 2 the second visit data. This imputation procedure was opted after it has been established that there was no significant difference between using the ratio and the multiplier '2'.
The set of samples selected for the 2006 FIES is only one of the possible sets of samples of equal size that could have been selected from the same population using the same sampling design. Estimates derived from each of these sets of samples would differ from one another. Sampling error is a measure of the variability of the estimates among all possible sets of samples. It is usually measured in terms of the standard error for a particular statistic.
The standard error can be used to calculate confidence intervals within which the true value for the population can reasonably be assumed to fall. For example, for any given statistic calculated from a sample survey, the value of that statistic will fall within a range of plus or minus two times the standard error of that statistic in 95 percent of all possible samples of the same size and design.
Source: National Statistics Office
Manila, Philippines
| Attachment | Size |
|---|---|
|
|
6.36 KB |
|
|
6.16 KB |
|
|
5.55 KB |