1. Philippines
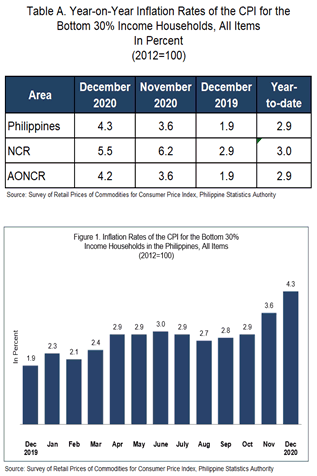
Inflation for the bottom 30% income households at the national level went up further to 4.3 percent in December 2020. In November 2020, it was posted at 3.6 percent, and in December 2019, 1.9 percent. (Table A, and Figure 1)
Higher annual increment in the index of the heavily-weighted food and non-alcoholic beverages at 3.6 percent primarily pushed up the overall inflation during the month.
Moreover, the indices of the following commodity groups also exhibited faster annual increases in December 2020:
a. Alcoholic beverages and tobacco, 13.7 percent;
b. Clothing and footwear, 2.4 percent;
c. Furnishing, household equipment and routine maintenance of the house, 1.6 percent;
d. Health, 2.8 percent;
e. Transport, 18.1 percent; and
f. Restaurant and miscellaneous goods and services, 3.2 percent.
Similarly, the annual rate of recreation and culture index inched up by 0.1 percent during the month, from an annual drop of -0.1 percent in the previous month.
On the other hand, the index of housing, water, electricity, gas, and other fuels posted a slower annual gain of 1.8 percent during the month, while the indices of communication and education retained their previous month’s annual increments of 0.4 percent and 1.5 percent, respectively. (Tables 3 ,and 4)
Inflation for food at the national level accelerated further to 3.7 percent in December 2020. In the previous month, its annual increase was observed at 3.0 percent and in the same month in 2019, 0.1 percent. (Table 7)
The indices of the following food groups exhibited faster annual increments during the period:
a. Meat, 7.2 percent;
b. Oils and fats, 3.4 percent;
c. Fruits, 9.4 percent; and
d. Vegetables, 17.2 percent.
On the other hand, annual increases slowed down in the indices of the following food groups in December 2020:
a. Other cereals, flour, cereal preparation, bread, pasta and other bakery products; and fish, both 2.4 percent;
b. Milk, cheese and eggs, 3.3 percent; and
c. Food products, not elsewhere classified, 6.1 percent
Moreover, the annual rate of corn index decreased further by -2.2 percent during the month. (Table 5)
The indices for rice; and sugar, jam, honey, chocolate and confectionery both recorded zero percent annual rate during the month, from -0.6 percent and -0.2 percent, respectively, in the previous month.
The country’s annual average inflation for the bottom 30% income households for the year 2020 picked up to 2.9 percent, from 2.4 percent in 2019.
Relative to their annual average growth rates in 2019, the following commodity groups exhibited higher annual average inflation in 2020:
a. Food and non-alcoholic beverages, 1.8 percent;
b. Alcoholic beverages and tobacco, 18.8 percent;
c. Transport, 7.8 percent; and
d. Communication, 0.4 percent.
In addition, the annual average rate of education index climbed to 2.7 percent during the year, from an annual average decline of -9.3 percent in 2019.
However, the annual average inflation were slower during the year in the following commodity groups:
a. Clothing and footwear, 2.5 percent;
b. Housing, water, electricity, gas, and other fuels, 2.0 percent;
c. Furnishing, household equipment and routine maintenance of the house, 1.6 percent;
d. Health, 3.2 percent;
e. Recreation and culture, 1.6 percent; and
f. Restaurant and miscellaneous goods and services, 2.8 percent. (Tables 3, and 4a)
| Table B. Year-on-Year Inflation Rates of the CPI for the Bottom 30% Income Households in the Philippines, All Items January 2016 – December 2020 (2012=100) | |||||
| Month | Year | ||||
| 2016 | 2017 | 2018 | 2019 | 2020 | |
| January | 0.7 | 2.0 | 3.6 | 5.2 | 2.3 |
| February | 0.8 | 2.2 | 4.4 | 4.3 | 2.1 |
| March | 0.8 | 2.2 | 5.0 | 3.4 | 2.4 |
| April | 0.6 | 2.4 | 5.2 | 3.1 | 2.9 |
| May | 1.0 | 2.1 | 5.4 | 3.2 | 2.9 |
| June | 1.2 | 2.1 | 5.4 | 3.1 | 3.0 |
| July | 1.1 | 1.9 | 6.2 | 2.5 | 2.9 |
| August | 1.0 | 2.3 | 6.9 | 1.7 | 2.7 |
| September | 1.2 | 2.5 | 8.0 | 0.2 | 2.8 |
| October | 1.5 | 2.7 | 8.1 | -0.1 | 2.9 |
| November | 1.5 | 2.6 | 7.3 | 0.7 | 3.6 |
| December | 1.8 | 2.7 | 6.3 | 1.9 | 4.3 |
| Average | 1.1 | 2.3 | 6.0 | 2.4 | 2.9 |
Source: Survey of Retail Prices of Commodities for Consumer Price Index, Philippine Statistics Authority
2. National Capital Region (NCR)
Inflation for the bottom 30% income households in NCR, however, eased to 5.5 percent in December 2020. Inflation in the area in November 2020 was 6.2 percent, and in the same month in 2019, 2.9 percent. (Tables A, and 3)
Slowdown in the inflation in NCR during the month was brought about by the -0.6 percent annual drop in housing, water, electricity, gas, and other fuels index. The annual rate of communication index also went down by -0.3 percent during the month.
Moreover, lower annual increases were registered in the indices of the following commodity groups during the month:
a. Food and non-alcoholic beverages, 7.8 percent;
b. Furnishing, household equipment and routine maintenance of the house, 1.2 percent;
c. Health, 1.6 percent;
d. Recreation and culture, 0.4 percent; and
e. Restaurant and miscellaneous goods and services, 1.6 percent.
On the other hand, annual upticks were higher in the indices of alcoholic beverages and tobacco at 12.0 percent; and transport at 23.4 percent, while the indices of clothing and footwear; and education retained their previous month’s annual growth rates. (Tables 3, and 4)
The annual average inflation in NCR accelerated to 3.0 percent in 2020, from 2.3 percent in 2019. (Tables 3, and 4a)
3. Areas Outside NCR (AONCR)
Following the trend at the national level, inflation for this particular income group of consumers in AONCR jumped further to 4.2 percent in December 2020. In the previous month, inflation in the area was observed at 3.6 percent and in December 2019, 1.9 percent. (Tables A, and 3)
Higher annual mark-ups were noted in the indices of the following commodity groups during the period:
a. Food and non-alcoholic beverages, 3.5 percent;
b. Alcoholic beverages and tobacco, 13.7 percent;
c. Clothing and footwear, 2.5 percent;
d. Furnishing, household equipment and routine maintenance of the house, 1.7 percent;
e. Health, 2.9 percent;
f. Transport, 18.0 percent; and
g. Restaurant and miscellaneous goods and services, 3.4 percent.
Recreation and culture index posted zero percent annual rate in December 2020, from an annual decrease of -0.2 percent in the previous month.
The indices of the rest of the commodity groups either registered a slower annual rate during the month or moved at their previous month’s annual increases. (Tables 3, and 4)
Ten (10) regions in AONCR exhibited higher inflation for the bottom 30% income households in December 2020. The highest inflation in the regions outside NCR during the month remained in Region II (Cagayan Valley) at 7.1 percent, while the lowest inflation was still seen in Region IX (Zamboanga Peninsula) at -1.1 percent. (Table 4)
The annual average inflation in AONCR went up by 2.9 percent in 2020, from 2.4 percent in 2019. (Tables 3, and 4a)
Compared with their 2019 annual average rates, 11 regions in AONCR had higher annual average inflation in 2020. Region II (Cagayan Valley) had the highest annual average inflation during the year at 4.0 percent. On the other hand, Region IX (Zamboanga Peninsula) recorded the lowest annual average inflation at 0.5 percent. (Table 4a)
Note:
Consumer Price Indices (CPIs) and inflation rates for the bottom 30% income households by province and selected city are posted at the Philippine Statistics Authority website (http://openstat.psa.gov.ph/).
See more at the Consumer Price Index for Bottom 30% Income Households Main page.