1. Philippines
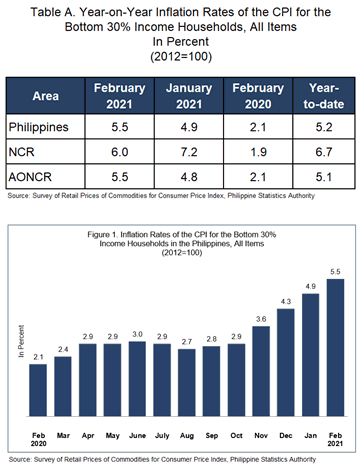
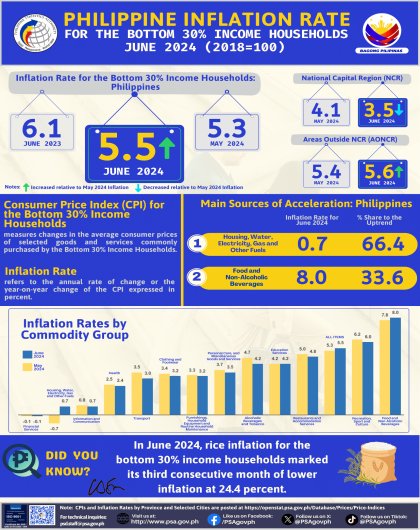
Inflation for the bottom 30% income households at the national level continued to move upward as it rose further to 5.5 percent in February 2021. This is the highest inflation for the bottom 30% income households since January 2019.
In January 2021, inflation for this income group of consumers was observed at 4.9 percent, and in the same month of the previous year, 2.1 percent. (Table A and Figure 1)
Largely contributing to the uptrend in the inflation for the bottom 30% income households was the higher annual increment in the index of the heavily-weighted food and non-alcoholic beverages at 5.6 percent in February 2021, from 4.6 percent in January 2021.
Moreover, the indices of the following commodity groups also exhibited higher inflation in February 2021:
a. Alcoholic beverages and tobacco, 13.8 percent;
b. Furnishing, household equipment and routine maintenance of the house, 1.7 percent;
c. Transport, 19.2 percent;
d. Communication, 0.5 percent; and
e. Restaurant and miscellaneous goods and services, 4.1 percent.
The index of recreation and culture registered a zero annual growth in February 2021, from an annual rate of 0.1 percent in the previous month.
Meanwhile, the indices of the rest of the commodity groups retained their previous month’s annual growth rates. (Tables 3 and 4)
The country’s food inflation for the bottom 30% income households climbed further to 5.8 percent in February 2021. In the previous month, the annual rate of food index was noted at 4.8 percent and in February 2020, 0.3 percent. (Table 7)
Higher annual increments were observed in the indices of the following food groups during the month:
a. Rice, 0.6 percent;
b. Meat, 17.1 percent;
c. Fish, 5.5 percent;
d. Oils and fats, 4.9 percent; and
e. Food products, not elsewhere classified, 6.3 percent.
In addition, the index for corn recorded an annual rate of 2.6 percent in February 2021, from an annual decline of -1.1 percent in January 2021.
The indices of the rest of the food groups posted slower annual hikes in February 2021. (Table 5)
| Table B. Year-on-Year Inflation Rates of the CPI for the Bottom 30% Income Households in the Philippines, All Items January 2017 – February 2021 (2012=100) | |||||
| Month | Year | ||||
| 2017 | 2018 | 2019 | 2020 | 2021 | |
| January | 2.0 | 3.6 | 5.2 | 2.3 | 4.9 |
| February | 2.2 | 4.4 | 4.3 | 2.1 | 5.5 |
| March | 2.2 | 5.0 | 3.4 | 2.4 | |
| April | 2.4 | 5.2 | 3.1 | 2.9 | |
| May | 2.1 | 5.4 | 3.2 | 2.9 | |
| June | 2.1 | 5.4 | 3.1 | 3.0 | |
| July | 1.9 | 6.2 | 2.5 | 2.9 | |
| August | 2.3 | 6.9 | 1.7 | 2.7 | |
| September | 2.5 | 8.0 | 0.2 | 2.8 | |
| October | 2.7 | 8.1 | -0.1 | 2.9 | |
| November | 2.6 | 7.3 | 0.7 | 3.6 | |
| December | 2.7 | 6.3 | 1.9 | 4.3 | |
| Average | 2.3 | 6.0 | 2.4 | 2.9 | |
Source: Survey of Retail Prices of Commodities for Consumer Price Index, Philippine Statistics Authority
2. National Capital Region (NCR)
Inflation of consumer items for the bottom 30% income households in NCR, however, eased to 6.0 percent in February 2021. Inflation in the region in January 2021 was observed at 7.2 percent and in the same month in 2020, 1.9 percent. (Tables A and 3)
Annual increases slowed down in the indices of the following commodity groups during the month:
a. Food and non-alcoholic beverages, 8.0 percent;
b. Clothing and footwear, 1.0 percent;
c. Furnishing, household equipment and routine maintenance of the house, 0.8 percent; and
d. Health, 1.6 percent.
On the other hand, annual upticks were higher in the indices of alcoholic beverages and tobacco at 13.7 percent; housing, water, electricity, gas, and other fuels, 1.5 percent; and transport, 23.8 percent. Moreover, the annual rate of the index of communication inched up to 0.2 percent in February 2021, after exhibiting an annual decline of -0.4 in the previous month. Meanwhile, the indices of the rest of the commodity groups retained their previous month’s annual growth rates. (Tables 3, and 4)
3. Areas Outside NCR (AONCR)
Similar to the trend of the national level, inflation for this particular income group of consumers in AONCR also went up further to 5.5 percent in February 2021. Inflation in the area in February 2021 was posted at 4.8 percent and in the same month of the previous year, 2.1 percent. (Tables A, and 3)
The indices of the following commodity groups registered higher annual increases during the month:
a. Food and non-alcoholic beverages, 5.5 percent;
b. Furnishing, household equipment and routine maintenance of the house, 1.8 percent;
c. Health, 3.0 percent;
d. Transport, 19.0 percent; and
e. Restaurant and miscellaneous goods and services, 4.3 percent.
Meanwhile, the indices of the rest of the commodity groups retained their previous month’s annual growth rates, except for recreation and culture which posted a zero percent annual growth duirng the month. (Tables 3 and 4)
Twelve (12) regions in AONCR had higher inflation for the bottom 30% income households in February 2021. In addition, Region IX (Zamboanga Peninsula) recorded an annual rate of 0.6 percent during the month, from an annual drop of -1.1 percent in January 2021. The highest inflation among the regions outside NCR in February 2021 remained in Region II (Cagayan Valley) at 8.6 percent, while the lowest inflation was still noticed in Region IX (Zamboanga Peninsula) at 0.6 percent. (Table 4)
Note:
CPIs and inflation rates for the bottom 30% income households by province and selected city are posted at the PSA website (http://openstat.psa.gov.ph/)