Table A. Year-on-Year Inflation Rates
for the Bottom 30% Income Households, All Items
In Percent
(2018=100)
|
|
|
|
|
|---|---|---|---|---|
| Philippines | 9.4 | 4.9 | 5.0 | 6.7 |
| NCR | 8.4 | 4.9 | 4.2 | 7.2 |
| AONCR | 9.4 | 4.9 | 5.0 | 6.7 |
| Source: Philippine Statistics Authority, Retail Price Survey of Commodities for the Generation of Consumer Price Index *Year-on-year change of average CPI for January to December 2023 vs. 2022 | ||||
A. Philippines
1. Overall Inflation
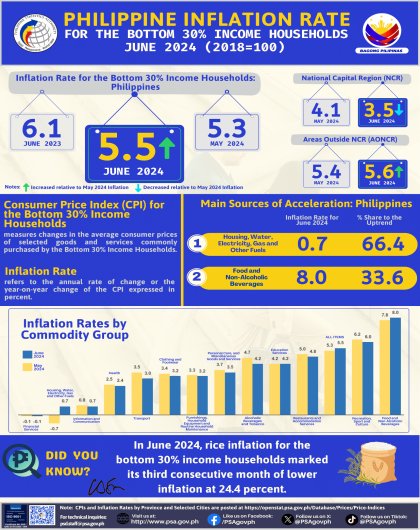
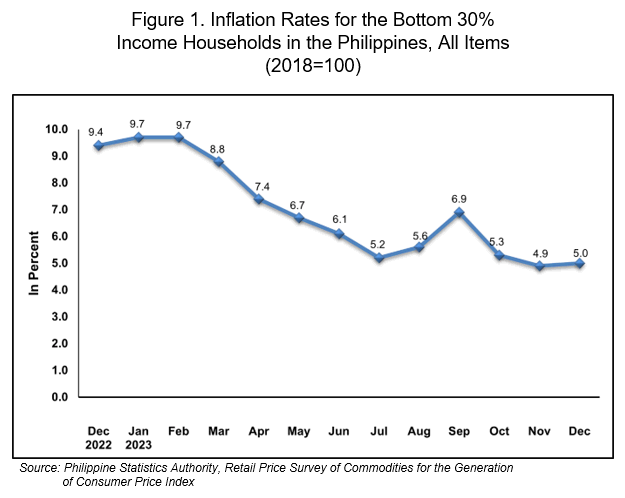
The country’s inflation rate for the bottom 30% income households increased to 5.0 percent in December 2023 from 4.9 percent in November 2023. In December 2022, inflation rate was posted at 9.4 percent. (Figure 1, and Tables A, B, 5, 6, and 12)
1.1 Main Drivers to the Upward Trend of the Overall Inflation
The primary driver to the upward trend of the overall inflation for this income group in December 2023 was the higher inflation for the heavily-weighted food and non-alcoholic beverages at 7.4 percent during the month from 7.2 percent in the previous month. Also contributing to the uptrend of inflation for this income group were the higher annual increases observed in transport at 1.5 percent in December 2023 from 0.9 percent in the previous month, and health at 3.2 percent annual increase during the period from 3.1 percent annual increment in November 2023.
In contrast, lower annual increases were noted in the indices of the following commodity groups during the period:
a. Clothing and footwear, 4.1 percent from 4.3 percent;
b. Furnishings, household equipment and routine household maintenance, 4.6 percent from 4.9 percent;
c. Recreation, sport and culture, 6.7 percent from 6.9 percent;
d. Restaurants and accommodation services, 5.9 percent from 6.0 percent; and
e. Personal care, and miscellaneous goods and services, 4.8 percent from 4.9 percent.
Moreover, the index of housing, water, electricity, gas and other fuels dropped further by 2.8 percent in December 2023 from a 2.4 percent annual decrease in the previous month.
The indices of the rest of the commodity group retained their previous month’s annual rates. (Tables 5 and 6)
1.2 Main Contributor to the Overall Inflation
The following commodity groups were the top three contributors to the December 2023 overall inflation for the bottom 30% income households:
a. Food and non-alcoholic beverages, 81.6 percent share or 4.1 percentage points;
b. Restaurants and accommodation services, 8.9 percent share or 0.4 percentage point; and
c. Alcoholic beverages and tobacco, 5.1 percent share or 0.3 percentage point.
1.3 Annual Average Inflation
The average inflation rate for 2023 for this income group was observed at 6.7 percent, higher than the 2022 average inflation rate of 6.6 percent. (Tables 5, 6A, and 12)
Compared with their respective annual average inflation rates in 2022, the indices of the following commodity groups recorded higher annual average inflation rates in 2023:
a. Food and non-alcoholic beverages, 8.2 percent from 6.2 percent;
b. Alcoholic beverages and tobacco, 11.2 percent from 8.6 percent;
c. Clothing and footwear, 5.0 percent from 2.8 percent;
d. Furnishings, household equipment and routine household maintenance, 5.7 percent from 2.9 percent;
e. Health, 3.4 percent from 2.5 percent;
f. Information and communication, 0.8 percent from 0.4 percent;
g. Recreation, sport and culture, 6.1 percent from 2.7 percent;
h. Education services, 3.8 percent from 1.3 percent;
i. Restaurants and accommodation services, 7.3 percent from 4.3 percent; and
j. Personal care, and miscellaneous goods and services, 5.7 percent from 3.3 percent.
On the other hand, lower average inflation rates in 2023 were recorded in the indices of housing, water, electricity, gas and other fuels at 3.7 percent from 9.8 percent in 2022, and transport at 2.7 percent from 10.8 percent in the previous year. Meanwhile, the financial services index recorded an annual average inflation rate of zero percent during the year from 8.9 percent in 2022. (Tables 5 and 6A)
2. Food Inflation
Food inflation for the bottom 30% income households at the national level remained at 7.4 percent in December 2023. In December 2022, its annual increase was observed at 10.2 percent. (Table 9)
2.1 Main Contributors to the Food Inflation
Food inflation contributed 78.4 percent or 3.9 percentage points to the December 2023 overall inflation for this particular income group.
Among the food groups, the main contributors to the food inflation during the month were the following:
a. Cereals and cereal products, which includes rice, corn, flour, bread and other bakery products, pasta products, and other cereals, with 84.6 percent share or 6.3 percentage points;
b. Fish and other seafood with 7.2 percent share or 0.5 percentage point; and
c. Milk, other dairy products and eggs with 6.3 percent share or 0.5 percentage point.
2.3 Annual Average Food Inflation Rate
In 2023, the average food inflation rate for the bottom 30% income households was observed at 8.3 percent, which was higher than the recorded average food inflation rate of 6.4 percent in 2022. (Table 9)

B. National Capital Region (NCR)
Inflation for the bottom 30% income households in NCR eased to 4.2 percent in December 2023 from 4.9 percent in November 2023. In December 2022, inflation in the area was observed at 8.4 percent. (Tables A, 5, 6, and 13)
The downtrend of the inflation in the area was mainly brought about by the lower annual increment in housing, water, electricity, gas and other fuels at 5.8 percent during the month from 8.1 percent in November 2023. Also contributing to the downtrend of inflation in the area was the lower annual increment in food and non-alcoholic beverages index at 3.4 percent from 4.0 percent in the previous month.
In addition, lower annual increments were noted in the indices of furnishings, household equipment and routine household maintenance at 4.5 percent in December 2023 from 4.6 percent in the previous month, and information and communication at 0.2 percent during the month from 0.3 percent in November 2023.
On the other hand, faster annual increment was observed in the indices of the following commodity groups during the month:
a. Clothing and footwear, 2.6 percent from 2.5 percent;
b. Health, 1.9 percent from 1.7 percent; and
c. Transport, 3.0 percent from 2.6 percent.
The indices of the rest of the commodity groups remained at their respective previous month’s annual rates. (Tables 5 and 6)
The average inflation rate in the area for 2023 stood at 7.2 percent, which was higher than the 5.2 percent average inflation rate in 2022. (Tables 6A and 13)
C. Areas Outside NCR (AONCR)
Following the trend at the national level, inflation for the bottom 30% income households in AONCR also recorded an uptrend at 5.0 percent in December 2023 from 4.9 percent in November 2023. In December 2022, inflation for this income group was registered at 9.4 percent. (Tables A, 5, and 14)
The acceleration of inflation in the area was mainly brought about by the higher year-on-year increment in the heavily-weighted food and non-alcoholic beverages at 7.5 percent in December 2023 from 7.3 percent in November 2023. Also contributing to the uptrend of inflation in the area was the faster annual increase in transport at 1.4 percent during the month from 0.8 percent in the previous month.
In addition, faster annual growth rates were observed in the indices of alcoholic beverages and tobacco at 9.9 percent in December 2023 from 9.8 percent in November 2023, and health at 3.2 percent from 3.1 percent.
In contrast, lower annual increases were noted in the indices of the following commodity groups during the period:
a. Clothing and footwear, 4.2 percent from 4.4 percent;
b. Furnishings, household equipment and routine household maintenance, 4.6 percent from 4.9 percent;
c. Recreation, sport and culture, 6.7 percent from 6.9 percent;
d. Restaurants and accommodation services, 6.0 percent from 6.1 percent; and
e. Personal care, and miscellaneous goods and services, 4.8 percent from 5.0 percent.
Moreover, the annual rate of housing, water, electricity, gas and other fuels index decreased further by 3.3 percent in December 2023 from an annual drop of 3.0 percent in the previous month.
The indices of the rest of the commodity groups remained at their respective previous month’s annual rates. (Tables 5 and 6)
In December 2023, seven regions outside NCR recorded higher inflation rates for the bottom 30% income households relative to their respective inflation rates in the previous month. The highest inflation rate was recorded in Region III (Central Luzon) and Region IX (Zamboanga Peninsula), both at 5.9 percent. On the other hand, the lowest inflation rate was observed in Region II (Cagayan Valley) at 1.1 percent. (Table 6)
The average inflation rate for 2023 in AONCR was observed at 6.7 percent, higher than the average inflation rate of 6.6 percent in 2022. (Tables 6A and 14)
Relative to their 2022 average inflation rates, nine regions outside NCR recorded higher average inflation rates in 2023. Region VI (Western Visayas) registered the highest average inflation rate of 8.0 percent in 2023. On the contrary, the lowest average inflation rate among the regions was observed at 5.4 percent in Region II (Cagayan Valley). (Table 6A)
Note: CPIs and inflation rates for the bottom 30% income households by region are posted at the PSA OpenSTAT portal at https://openstat.psa.gov.ph/PXWeb/pxweb/en/DB/DB__2M__PI__BIH__2018/?tablelist=true.
CLAIRE DENNIS S. MAPA, PhD
Undersecretary
National Statistician and Civil Registrar General
See more at the Consumer Price Index for Bottom 30% Income Households main page.