Construction Materials Wholesale Price Index in the National Capital Region (2018=100): June 2024
Table A. Year-on-Year Growth Rates of the CMWPI in NCR, All Items
In Percent
(2012=100)
| 1.0 | 0.8 | 1.2 | 1.2 |
Source : Philippine Statistics Authority
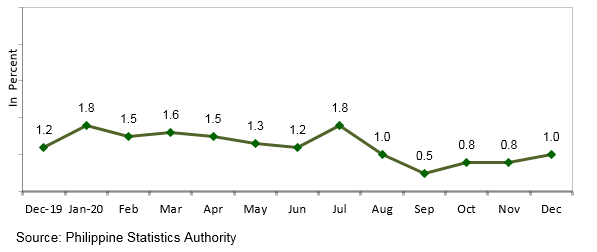
Figure 1. Annual Growth Rates of the CMWPI in NCR, All Items
December 2019 - December 2020
(2012=100)

CMWPI in NCR picks up during the month
The annual rate of CMWPI in NCR went up by 1.0 percent in December 2020. In the previous month, its annual change was posted at 0.8 percent, and in December 2019, 1.2 percent. (Tables A and 2)
Relative to their annual rates in the previous month, annual increases were higher in the indices of the following commodity groups in December 2020:
a. Sand and gravel, 2.9 percent;
b. G.I. sheet, 1.2 percent;
c. Electrical works, 1.6 percent; and
d. PVC pipes, 4.8 percent.
On the other hand, annual gains were slower in the indices of concrete products and cement at 1.0 percent; and hardware, 2.6 percent. Moreover, annual declines were still registered in the indices of the following commodity groups during the period:
a. Plywood, -0.1 percent;
b. Reinforcing and structural steel, -0.8 percent;
c. Plumbing fixtures and accessories/waterworks, -1.4 percent; and
d. Fuels and lubricants, -8.1 percent.
The indices of the rest of the commodity groups either retained their previous month’s annual growth rates or still had zero percent annual growth during the month.
The annual average rate of CMWPI for the year 2020 slowed down to 1.2 percent, from 3.0 percent in 2019.
Annual average rates during the year went down in the indices of plywood at -0.4 percent; reinforcing and structural steel, -0.6 percent; and fuels and lubricants, -8.6 percent.
In addition, annual average increases during the year decelerated in the indices of the following commodity groups:
a. Sand and gravel, 1.7 percent;
b. Concrete products and cement, 1.4 percent;
c. Lumber, 3.8 percent;
d. G.I. sheet, 1.9 percent;
e. Doors, jambs, and steel casement, 0.1 percent;
f. Electrical works, 1.6 percent; and
g. Plumbing fixtures and accessories/waterworks, 0.3 percent.
Compared with their annual average rates in 2019, the indices of the following commodity groups, however, registered faster annual average increments in 2020:
a. Hardware, 4.0 percent;
b. Tileworks, 15.7 percent;
c. Painting works, 0.8 percent; and
d. PVC pipes, 5.8 percent.
Similarly, the annual average rate of glass and glass products index advanced to 7.1 percent in 2020, from its annual average rate of zero percent in 2019. Meanwhile, the annual average rate of the indices of asphalt; and machinery and equipment rental in 2020 remained at zero percent. (Table 2)
See more at the Construction Materials Wholesale Price Index Main page.
