
Summary Inflation Report Consumer Price Index (2018=100): June 2024
YEAR-ON-YEAR
Philippines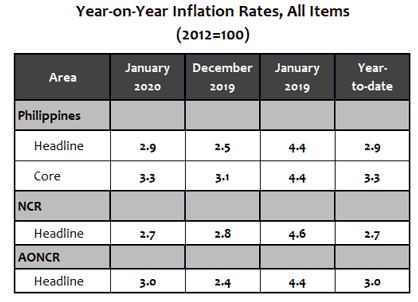
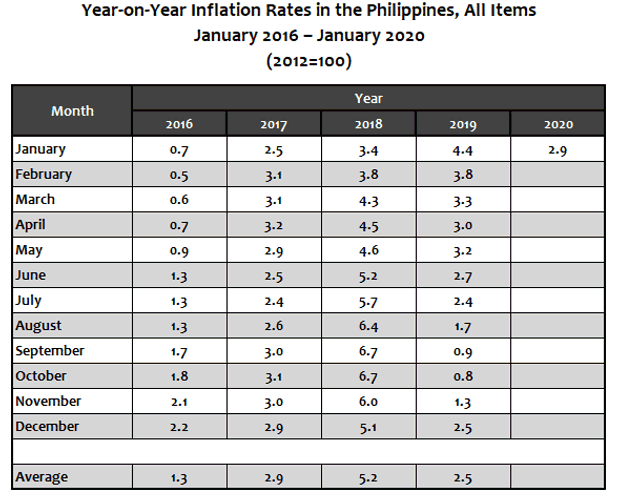
The year 2020 started off with a higher national headline inflation rate of 2.9 percent. This is the highest inflation recorded since June 2019, in which the inflation was posted at 2.7 percent.
The annual rate in December 2019 was 2.5 percent and in January 2019, 4.4 percent.
The heavily-weighted food and non-alcoholic beverages index, which registered an annual increment of 2.2 percent, primarily contributed to the uptrend of inflation in January 2020. In addition, inflation in the following commodity groups were higher during the month:
- Alcoholic beverages and tobacco, 19.2 percent;
- Clothing and footwear, 2.7 percent;
- Housing, water, electricity, gas, and other fuels, 2.5 percent;
- Transport, 3.0 percent;
- Recreation and culture, 1.5 percent; and
- Education, 4.7 percent.
(Tables 3 and 4)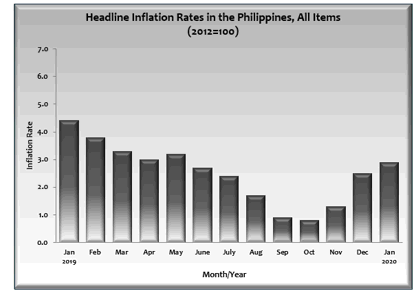
On the other hand, a slower annual increase of 2.6 percent was noted in restaurant and miscellaneous goods and services index during the month. The rest of the commodity groups retained their previous month’s annual rates. (Tables 3 and 4)
Excluding selected food and energy items, core inflation went up further by 3.3 percent in January 2020. Core inflation was observed at 3.1 percent in December 2019, while it was 4.4 percent in the same period in 2019. (Table 9)
The annual growth rate of food index at the national level, likewise, increased further by 2.1 percent during the month. Food inflation in December 2019 was 1.7 percent and in January 2019, 5.1 percent. (Table 7)
The following food groups registered higher annual mark-ups in January 2020:
- Meat, 3.4 percent;
- Fish, 8.8 percent;
- Oils and fats, 0.7 percent;
- Fruit, 7.7 percent;
- Vegetables, 8.3 percent; and
- Food products, not elsewhere classifed, 6.8 percent.
Meanwhile, annual rates in the indices of rice declined by 6.5 percent; corn, 1.5 percent; and sugar, jam, honey, chocolate and confectionery, 2.2 percent. The rest of the food groups retained their previous month’s annual growth rates. (Table 5)
National Capital Region (NCR)
Inflation in NCR, however, slowed down to 2.7 percent in January 2020. Its annual rate was posted at 2.8 percent in December 2019, and 4.6 percent in January 2019.
This downtrend was effected by the slowdown in the annual increase of food and non-alcoholic beverages index at 3.4 percent during the month. Meanwhile, the following commodity groups exhibited higher annual upticks:
- Alcoholic beverages and tobacco, 13.6 percent;
- Housing, water, electricity, gas, and other fuels, 1.3 percent;
- Furnishing, household equipment and routine maintenance of the house, 2.0 percent;
- Health, 2.2 percent;
- Transport, 1.8 percent; and
- Education, 5.7 percent.
Other commodity groups retained their previous month’s annual rates. (Tables 3 and 4)
Areas Outside NCR (AONCR)
Following the trend in the national level, inflation in AONCR went up further by 3.0 percent in January 2020. In the previous month, inflation in AONCR was recorded at 2.4 percent and in the same month in 2019, 4.4 percent.
The following commodity groups registered higher annual rates during the month:
- Food and non-alcoholic beverages, 2.0 percent;
- Alcoholic beverages and tobacco, 20.2 percent;
- Clothing and footwear, 3.1 percent;
- Housing, water, electricity, gas, and other fuels, 3.0 percent; and
- Transport, 3.4 percent.
Meanwhile, the annual rates of increments were slower in the indices of furnishing, household equipment and routine maintenance of the house at 3.4 percent; health, 3.0 percent; and restaurant and miscellaneous goods and services, 2.5 percent. The rest of the commodity groups retained their previous month’s annual rates. (Tables 3 and 4)
Except in Cordillera Administrative Region (CAR), whose inflation remained at 2.8 percent, all the regions in areas outside NCR posted higher annual mark-ups in January 2020. The highest inflation was still observed in Region V (Bicol Region) at 3.9 percent, while the lowest remained in Bangsamoro Autonomous Region in Muslim Mindanao (BARMM) at 1.0 percent. (Table 4)
Note: CPIs and inflation rates by province and selected cities are posted at the PSA website (http://openstat.psa.gov.ph/).
(Sgd) CLAIRE DENNIS S. MAPA, Ph.D.
Undersecretary
National Statistician and Civil Registrar General
See more at the CPI and Inflation Rate page.

