
Summary Inflation Report Consumer Price Index (2018=100): June 2024
YEAR-ON-YEAR
Philippines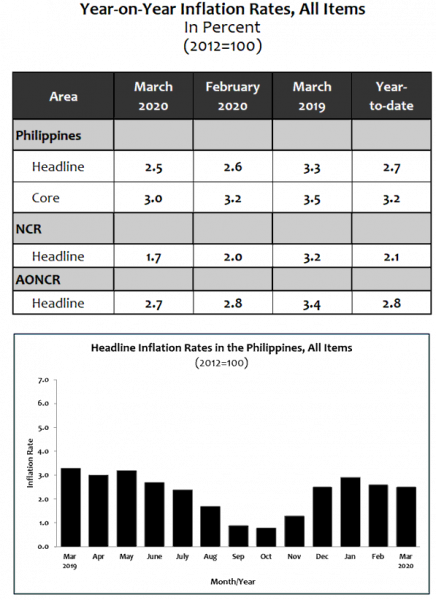
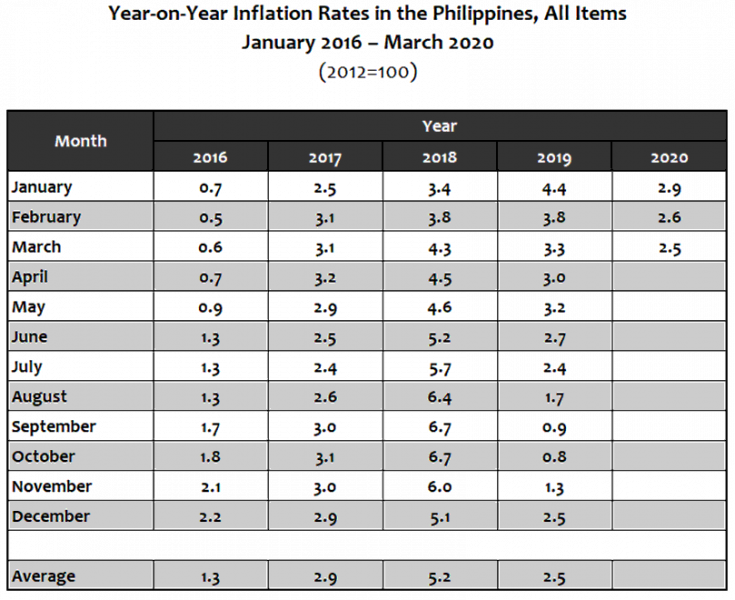
The headline inflation in the Philippines decelerated further to 2.5 percent in March 2020, from 2.6 percent in the previous month. Inflation in March a year ago was higher at 3.3 percent
The slowdown in inflation in March 2020 was primarily due to transport whose index dropped at an annual rate of 1.8 percent. Slower annual increments in the indices of alcoholic beverages and tobacco at 18.0 percent; and housing, water, electricity, gas, and other fuels at 1.1 percent, also pushed down the inflation during the month.
On the other hand, higher annual increases were noted in the following commodity groups:
- Food and non-alcoholic beverages, 2.6 percent;
- Furnishing, household equipment and routine maintenance of the house, 4.2 percent;
- Communication, 0.5 percent; and
- Recreation and culture, 1.6 percent.
The rest of the commodity groups retained their previous month’s annual growth rates. (Tables 3 and 4)
Excluding selected food and energy items, core inflation slowed down further to 3.0 percent in March 2020. In the previous month, core inflation was posted at 3.2 percent, and in March 2019, 3.5 percent. (Table 9)
For food, its annual rate at the national level climbed to 2.6 percent during the month. In the previous month, food inflation was 2.1 percent, and in March 2019, 3.1 percent. (Table 7)
The following food groups registered higher annual mark-ups during the period compared with their annual growth rates in February 2020:
- Fish, 10.5 percent;
- Oils and fats, 1.3 percent;
- Fruits, 9.9 percent;
- Vegetables, 8.1 percent; and
- Food products, not elsewhere classified, 7.1 percent.
On the contrary, slower annual growth rates were observed in the indices of other cereals, flour, cereal preparation, bread, pasta and other bakery products; and meat, both at 2.6 percent. The index of milk, cheese and egg retained its previous month’s annual rate of 3.4 percent. The rest of the food groups such as rice and corn exhibited annual declines during the month. (Table 5)
National Capital Region (NCR)
Inflation in NCR decelerated further to 1.7 percent during the month, from 2.0 percent in February 2020. In March 2019, inflation was higher at 3.2 percent.
Commodity groups that primarily pushed down the inflation in NCR during the month were housing, water, electricity, gas, and other fuels; and transport whose indices declined at annual rates of 0.9 percent and 3.0 percent, respectively. Lower annual increments in the indices of health at 2.1 percent; recreation and culture, 0.8 percent; and restaurant and miscellaneous goods and services, 2.0 percent also slowed down the inflation in NCR during the month.
Higher annual mark-ups were, however, noted in the following commodity groups during the month:
• Food and non-alcoholic beverages, 3.5 percent;
• Alcoholic beverages and tobacco, 14.0 percent;
• Clothing and footwear, 1.2 percent;
• Furnishing, household equipment and routine maintenance of the house, 5.5 percent; and
• Communication, 0.3 percent.
The education index retained its previous month’s annual rate of 5.7 percent. (Tables 3 and 4)
Areas Outside NCR (AONCR)
Annual inflation in AONCR also continued to move slower at 2.7 percent in March 2020. Inflation in the area was recorded at 2.8 percent in the previous month and 3.4 percent in March 2019.
Contributing primarily to the downtrend in the inflation in AONCR was transport which dropped at an annual rate of 1.3 percent during the month. In addition, slowdowns in the annual increases were posted in the indices of alcoholic beverages and tobacco at 18.7 percent; housing, water, electricity, gas, and other fuels, 1.9 percent; and health, 2.9 percent.
Meanwhile, higher annual gains were noted in the following commodity groups:
• Food and non-alcoholic beverages, 2.4 percent;
• Clothing and footwear, 3.1 percent;
• Furnishing, household equipment and routine maintenance of the house, 3.8 percent;
• Communication, 0.5 percent;
• Recreation and culture, 1.8 percent; and
• Restaurant and miscellaneous goods and services, 2.7 percent.
The annual rate of education index remained at 4.2 percent during the month. (Tables 3 and 4)
Lower inflation was observed in 10 regions in AONCR in March 2020. Among the regions in AONCR, Region X (Northern Mindanao) registered the lowest inflation during the month at 2.0 percent, while Region V (Bicol Region) and Region XII (SOCCSKSARGEN) exhibited the highest inflation at 3.2 percent. (Table 4)
Notes:
- The PSA was able to collect prices of commodities such as food items and petroleum products during the implementation of Enhanced Community Quarantine in the entire Luzon and in other provinces of the country.
- CPIs and inflation rates by province and selected cities are posted at the PSA website (http://openstat.psa.gov.ph/).
(Sgd) CLAIRE DENNIS S. MAPA, Ph.D.
Undersecretary
National Statistician and Civil Registrar General
See more at the CPI and Inflation Rate page.

