
Summary Inflation Report Consumer Price Index (2018=100): June 2024
1. Philippines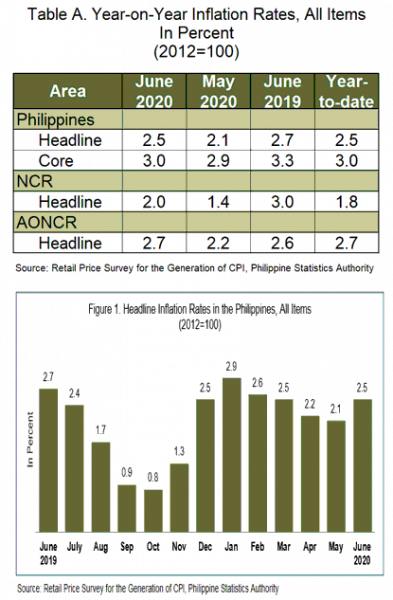
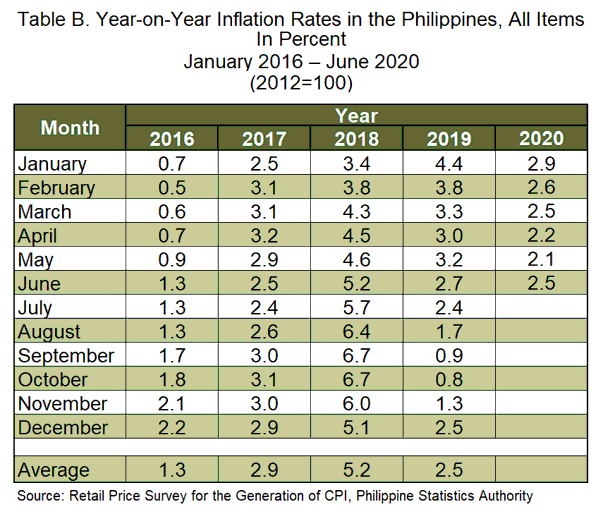
The country’s headline inflation went up to 2.5 percent in June 2020, after four consecutive months of deceleration. This makes the year-to-date inflation for 2020 at 2.5 percent. In May 2020, inflation was posted at 2.1 percent and in June 2019 at 2.7 percent. (Table A and Figure 1)
The uptrend in the June 2020 inflation was primarily brought about by the 2.3 percent annual increment recorded in the transport index, specifically, tricycle fare index, from a 5.6 percent annual decrease in May 2020.
Annual increases in the indices of alcoholic beverages and tobacco at 18.5 percent; and in housing, water, electricity, gas, and other fuels; and communication, both at 0.4 percent, also pushed up the June 2020 inflation.
Meanwhile, annual mark-ups slowed down in the indices of the following commodity groups during the period:
- Food and non-alcoholic beverages, 2.7 percent;
- Recreation and culture, 1.2 percent;
- Education, 1.6 percent; and
- Restaurant and miscellaneous goods and services, 2.3 percent.
Indices of the rest of the commodity groups such as clothing and footwear; furnishing, household equipment and routine maintenance of the house; and health were the same as their previous month’s annual growth rates. (Tables 3 and 4)
Core inflation likewise, recorded a higher annual gain of 3.0 percent in June 2020. In the previous month, core inflation was noted at 2.9 percent, while in the same month of 2019, it was 3.3 percent. (Table 9)
Food inflation in the country decelerated further to 2.7 percent in June 2020. It was 2.9 percent in the previous month and 2.6 percent in June 2019. (Table 7)
The indices of rice and sugar, jam, honey, chocolate and confectionery correspondingly registered annual declines of 1.9 percent and 0.7 percent in June 2020. Moreover, slower annual upticks were observed in the indices of the following food groups during the month:
- Other cereals, flour, cereal preparation, bread, pasta and other bakery products, 2.6 percent;
- Fish, 6.1 percent;
- Fruits, 10.0 percent;
- Vegetables, 4.8 percent; and
- Food products, not elsewhere classified, 5.5 percent.
The annual rate of the corn index climbed by 0.6 percent during the month, after exhibiting annual decreases for 16 consecutive months. The indices of the rest of the food groups had higher annual growth rates, except for the index of milk, cheese and egg whose annual rate remained at 3.5 percent. (Table 5)
2. National Capital Region (NCR)
Inflation in NCR climbed further to 2.0 percent in June 2020. In the previous month, inflation in the area was posted at 1.4 percent and in June 2019, 3.0 percent.
Largely contributing to the uptrend in the June 2020 inflation for NCR was transport index (tricycle fare) with a yearly growth of 8.6 percent, from an annual drop of 1.8 percent in the previous month. The increases in the indices for alcoholic beverages and tobacco at 13.9 percent and recreation and culture at 0.8 percent also pushed up the inflation in June 2020 in the area.
On the contrary, annual hikes slowed down in the indices of the following commodity groups during the month:
- Food and non-alcoholic beverages, 2.3 percent;
- Furnishing, household equipment and routine maintenance of the house, 5.7 percent;
- Communication, 0.2 percent; and
- Education, 0.8 percent.
The index of housing, water, electricity, gas, and other fuels still registered a downward movement as its annual rate went down by 1.1 percent during the month. Meanwhile, the indices of other commodity groups, such as clothing and footwear, health, and restaurant and miscellaneous goods and services, retained their previous month’s annual growth rates. (Tables 3 and 4)
3. Areas Outside NCR (AONCR)
Similar to the trend at the national level, inflation in AONCR accelerated to 2.7 percent in June 2020, after four successive months of deceleration. Inflation in the area in May 2020 was observed at 2.2 percent, while in the same month of the previous year, it was noted at 2.6 percent.
The annual rate of the transport index (tricycle fare) rose by 0.3 percent in June 2020, from -6.8 percent annual rate in May 2020. In addition, higher annual increments were posted in the indices of the following commodity groups:
- Alcoholic beverages and tobacco, 19.4 percent;
- Housing, water, electricity, gas, and other fuels, 1.0 percent;
- Health, 3.1 percent; and
- Communication, 0.4 percent.
On the other hand, annual increases slid in the indices of the following commodity groups during the month:
- Food and non-alcoholic beverages, 2.8 percent;
- Clothing and footwear, 2.7 percent;
- Recreation and culture, 1.4 percent;
- Education, 1.9 percent; and
- Restaurant and miscellaneous goods and services, 2.5 percent.
The index of furnishing, household equipment, and routine maintenance of the house retained its previous month’s annual rate of 3.6 percent. (Tables 3 and 4)
Compared with their inflation in May 2020, 11 regions in AONCR had higher inflation in June 2020. Among the regions outside NCR, the highest inflation during the month was observed in Region V (Bicol Region) at 4.3 percent, while the lowest was seen in Region VIII (Eastern Visayas) at 1.1 percent. (Table 4)
Note: CPIs and inflation rates by province and selected city are posted on the PSA website (http://openstat.psa.gov.ph/).
(Sgd) DENNIS S. MAPA, Ph.D.
Undersecretary
National Statistician and Civil Registrar General
See more at the CPI and Inflation Rate page.

