
Summary Inflation Report Consumer Price Index (2018=100): June 2024
1. Philippines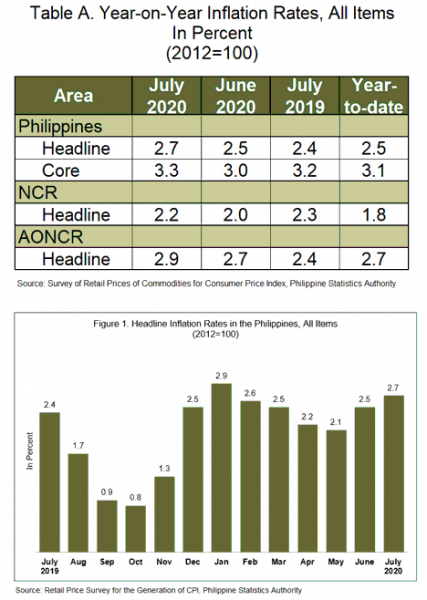
The Philippines’ headline inflation continued to exhibit a faster pace as it picked up to 2.7 percent in July 2020. This brings the year-to-date inflation for 2020 at 2.5 percent. In June 2020, inflation was posted at 2.5 percent and in July 2019, 2.4 percent. (Table A and Figure 1)
The acceleration in the overall inflation was mainly caused by the jump in the inflation of the transport index at 6.3 percent during the month, from 2.4 percent in June 2020.
Annual increments were also higher in the indices of the following commodity groups:
- Alcoholic beverages and tobacco at 19.3 percent;
- hHousing, water, electricity, gas, and other fuels, 0.8 percent; and
- Restaurant and miscellaneous goods and services, 2.5 percent.
Except for the health index whose annual rate remained at 2.8 percent, the six remaining commodity groups exhibited slower annual increases during the month. (Tables 3 and 4)
Similarly, core inflation went up further to 3.3 percent in July 2020 from 3.0 percent in the previous month and 3.2 percent in July a year ago. (Tables A and 9)
Meanwhile, inflation for the food index at the national level continued to decelerate as it posted 2.5 percent in July 2020, from 2.7 percent in the previous month. In July 2019, food inflation was registered at 1.7 percent. (Table 7)
Among the food groups, the indices of rice and sugar, jam, honey, chocolate and confectionery were still on a downtrend as their annual growth rates during the month fell to 1.2 percent and 0.1 percent, respectively. Annual declines were observed in the indices of rice since May 2019 and in sugar, jam, honey, chocolate and confectionery since July 2019. Likewise, the annual rate of corn index dropped to 0.1 percent during the month, from a 0.6 percent annual increment in the previous month. Moreover, annual hikes slowed down in the indices of fish at 3.8 percent; fruits, 8.5 percent; and vegetables, 0.9 percent.
On the contrary, annual mark-ups were higher in the indices of meat at 4.9 percent; oils and fats, 2.3 percent; and food products, not elsewhere classified, 5.7 percent. The indices of other food groups such as other cereals, flour, cereal preparation, bread, pasta, and other bakery products; and milk, cheese and egg retained their previous month’s annual growth rates of 2.6 percent and 3.5 percent, respectively. (Table 5)
2. National Capital Region (NCR)
Inflation in NCR was, likewise, higher at 2.2 percent in July 2020, from 2.0 percent in the previous month. The annual rate in the area was at 2.3 percent in July 2019. (Tables A and 3)
Double-digit annual increases were observed in the indices of alcoholic beverages and tobacco at 14.6 percent; and transport, 11.0 percent. In addition, health index registered a higher annual rate of 3.1 percent during the month.
Meanwhile, the following commodity groups had slower annual increments during the month:
- Food and non-alcoholic beverages, 2.2 percent;
- Clothing and footwear, 1.1 percent;
- Furnishing, household equipment and routine maintenance of the house, 5.6 percent;
- Communication, 0.1 percent;
- Recreation and culture, 0.7 percent; and
- Restaurant and miscellaneous goods and services, 1.8 percent.
The index of housing, water, electricity, gas, and other fuels still moved downward as its annual rate dropped to 0.6 percent in July 2020, while the index of education retained its previous month’s annual rate of 0.8 percent. (Tables 3 and 4)
3. Areas Outside NCR (AONCR)
Inflation in AONCR also moved up to 2.9 percent in July 2020. In June 2020, inflation was observed at 2.7 percent, while in July of the previous year, it was 2.4 percent. (Tables A and 3)
Annual growth rates were higher in the indices of the following commodity groups during the period:
- Alcoholic beverages and tobacco, 20.2 percent;
- Housing, water, electricity, gas, and other fuels, 1.2 percent;
- Transport, 4.9 percent; and
- Restaurant and miscellaneous goods and services, 2.7 percent.
The other commodity groups either exhibited slower annual gains in July 2020 or retained their previous month’s annual rate. (Tables 3 and 4)
Relative to their annual increases in the previous month, six regions in AONCR registered higher annual growth rates in July 2020. Among the regions outside NCR, Region V (Bicol Region) still posted the highest inflation at 4.2 percent, while the lowest was seen in Region XI (Davao Region) at 1.2 percent. (Table 4)
Note: CPIs and inflation rates by province and selected city are posted on the PSA website (http://openstat.psa.gov.ph/).
(Sgd) DENNIS S. MAPA, Ph.D.
Undersecretary
National Statistician and Civil Registrar General
See more at the CPI and Inflation Rate page.

