
Summary Inflation Report Consumer Price Index (2018=100): June 2024
1. Philippines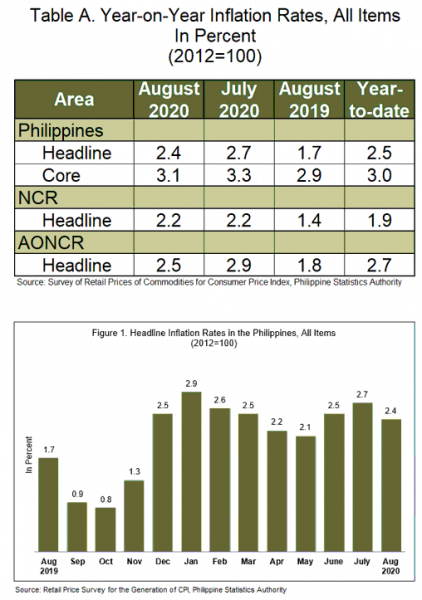
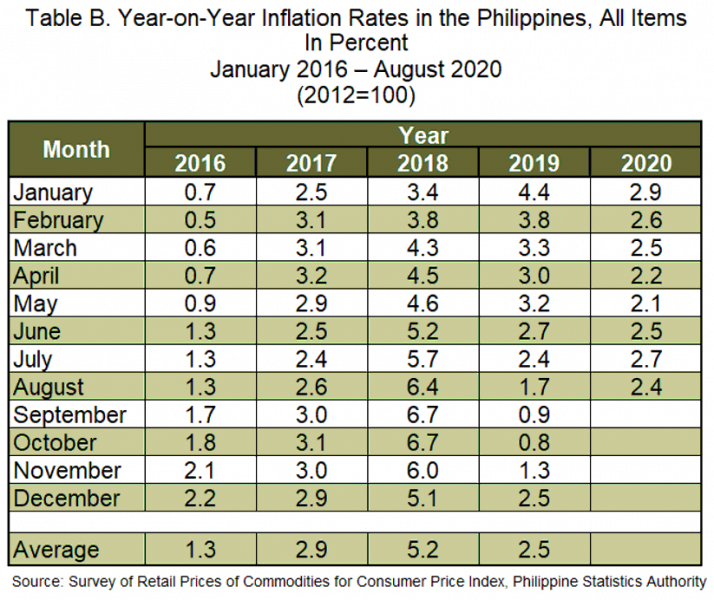
The headline inflation in the Philippines eased to 2.4 percent in August 2020, from 2.7 percent in the previous month. This brings the year-to-date inflation for 2020 at 2.5 percent. Inflation in August 2019 was lower at 1.7 percent. (Table A and Figure 1)
The slowdown in inflation in August 2020 was primarily due to the deceleration in the inflation for the heavily-weighted food and non-alcoholic beverages which slid at an annual rate of 1.8 percent during the period, from 2.4 percent in the previous month. Similarly, the indices of the following commodity groups posted lower inflation during the month:
- Alcoholic beverages and tobacco, 17.7 percent;
- Clothing and footwear, 1.9 percent;
- Furnishing, household equipment and routine maintenance of the house, 3.9 percent;
- Education, 0.1 percent; and
- Restaurant and miscellaneous goods and services, 2.3 percent.
Contributing also to the deceleration in the overall inflation was recreation and culture whose index exhibited an annual decline of -0.1 percent during the period, from an annual gain of 1.1 percent in the previous month.
On the other hand, inflation for housing, water, electricity, gas, and other fuels slightly went up by 0.9 percent, from 0.8 percent in the previous month. Retaining their previous month’s annual growth rates were health (2.8%), transport (6.3%), and communication (0.3%). (Tables 3, and 4)
Core inflation, which excludes selected food and energy items, slowed down to 3.1 percent in August 2020, from 3.3 percent in the previous month. Core inflation in August 2019 was recorded at 2.9 percent. (Tables A, and 9)
For food, the annual rate at the national level eased further to 1.7 percent during the month, from 2.5 percent in July 2020. In August 2019, inflation for food was far lower at 0.3 percent. (Table 7)
By specific food item, the indices for rice and corn dropped by -1.1 percent and -0.6 percent, respectively. Similarly, the index for vegetables went down by -0.9 percent during the month, from a 0.9 percent annual hike in the previous month.
Annual mark-up for the index of oils and fats was higher at 2.4 percent during the month. Likewise, the annual rate for sugar, jam, honey, chocolate and confectionery inched up to 0.1 percent. Meanwhile, annual rates of increments were slower in the indices of the remaining food groups. (Table 5)
2. National Capital Region (NCR)
Inflation in NCR was posted at 2.2 percent in August 2020. It was the same rate recorded in July 2020, while in August 2019, inflation in the area was at 1.4 percent. (Tables A, and 3)
Mixed movements in the annual growths were observed among the commodity groups. Relative to the annual rate in July 2020, annual increase in the transport index was higher at 11.9 percent during the month. On the other hand, slowdowns in the annual increments were seen in the indices of the following commodity groups:
- Food and non-alcoholic beverages, 1.8 percent;
- Alcoholic beverages and tobacco, 13.3 percent;
- Health, 3.0 percent;
- Education, 0.2 percent; and
- Restaurant and miscellaneous goods and services, 1.7 percent.
The index of housing, water, electricity, gas and other fuels eased at an annual rate of -0.2 percent during the month. Inflation for the rest of the commodity groups remained at their previous month’s rates. (Tables 3, and 4)
3. Areas Outside NCR (AONCR)
Following the national trend, inflation in AONCR decelerated to 2.5 percent in August 2020. In the previous month, inflation in the area was observed at 2.9 percent, while in the same month in 2019, it was posted at 1.8 percent. (Tables A, and 3)
The index of recreation and culture registered an annual decline of -0.3 percent in August 2020, from an annual increase of 1.2 percent in July 2020. Moreover, the indices of housing, water, electricity, gas, and other fuels; and communication retained their previous month’s annual growth rates of 1.2 percent, and 0.4 percent, respectively. Meanwhile, a zero annual growth during the period was noted in the index of education Meanwhile, other commodity groups exhibited slower annual increments during the month. (Tables 3 and 4)
Relative to their annual growth rates in July 2020, 12 regions in AONCR exhibited lower inflation during the month with Region XI (Davao Region) registering the lowest inflation at 0.2 percent. On the other hand, the highest inflation remained in Region V (Bicol Region) at 4.0 percent. (Table 4)
Note: CPIs and inflation rates by province and selected city are posted on the PSA website (http://openstat.psa.gov.ph/).
(Sgd) DENNIS S. MAPA, Ph.D.
Undersecretary
National Statistician and Civil Registrar General
See more at the CPI and Inflation Rate page.

