
Summary Inflation Report Consumer Price Index (2018=100): June 2024
1. Philippines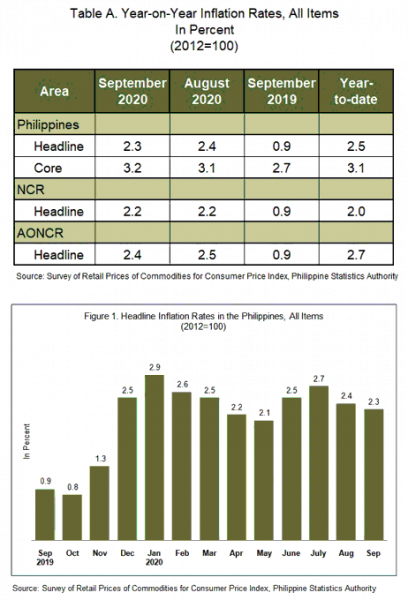
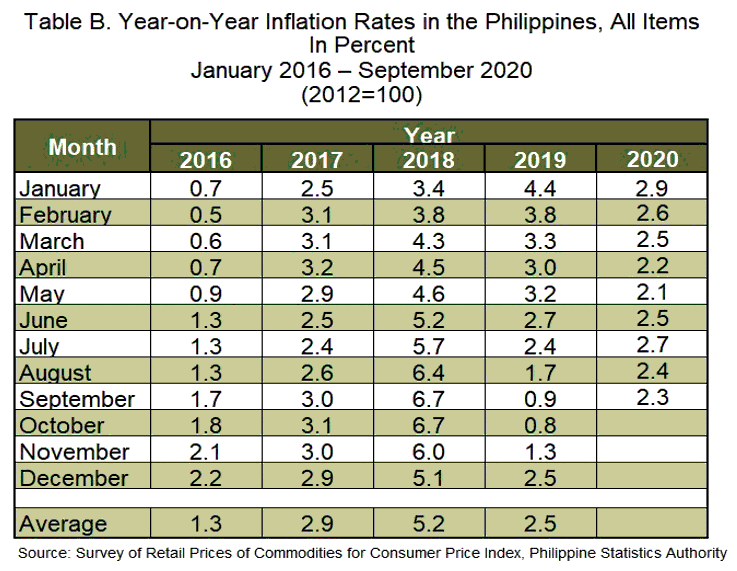
The headline inflation in the Philippines continued to exhibit a slower pace as it decelerated further to 2.3 percent in September 2020 from 2.4 percent in August 2020. In September 2019, inflation was lower at 0.9 percent. The year-to-date inflation for September 2020 remains at 2.5 percent. (Table A, and Figure 1)
The downtrend in the overall inflation in September 2020 was mainly caused by the slowdown in the inflation for the heavily-weighted food and non-alcoholic beverages which eased at an annual rate of 1.5 percent during the month, from 1.8 percent in the previous month. Likewise, slower inflation was recorded for alcoholic beverages and tobacco at 12.9 percent; clothing and footwear, 1.8 percent; and furnishing, household equipment and routine maintenance of the house, 3.7 percent. Moreover, the annual rate in the index of recreation and culture dropped further to -0.5 percent during the month.
Meanwhile, annual increases were higher during the month in the indices of housing, water,electricity, gas, and other fuels (1.2%); transport (8.3%); communication (0.4%); and education (0.9%). The rest of the commodity groups retained their previous month’s annual growth rates. (Tables 3, and 4)
Core inflation, which excludes selected food and energy items, inched up to 3.2 percent in September 2020, from 3.1 percent in the previous month. Core inflation in September 2019 was registered at 2.7 percent. (Tables A, and 9)
For the food inflation at the country level, it continued to decelerate to 1.5 percent during the month, from 1.7 percent in August 2020. In September 2019, food inflation was posted at -1.3 percent. (Table 7)
By food group, the indices for rice and corn both exhibited an annual decrease of -0.6 percent during the month. Likewise, the index for vegetables fell further to -2.7 percent during the period.
Moreover, annual increments slid in the indices of other cereals, flour, cereal preparation, bread, pasta and other bakery products at 2.3 percent; meat, 2.9 percent; milk, cheese, and egg, 2.4 percent; and food products, not elsewhere classified, 5.1 percent.
The remaining food groups either had higher annual increases or retained their previous month’s annual growth rates. (Table 5)
2. National Capital Region (NCR)
For three consecutive months now, inflation in NCR remained at 2.2 percent. In September 2019, inflation settled to 0.9 percent. (Tables A, and 3)
The annual rate of the index for housing, water, electricity, gas and other fuels picked up to 0.6 percent during the month, from -0.2 percent annual decrease in the previous month. Moreover, higher annual increases were seen in the indices of clothing and footwear (1.2%), communication (0.2%), and education (0.6%).
On the other hand, deceleration in the annual mark-ups were noted in the indices of the following commodity groups:
- Food and non-alcoholic beverages, 1.4 percent;
- Alcoholic beverages and tobacco, 10.4 percent;
- Transport, 11.5 percent; and
- Restaurant and miscellaneous goods and services, 1.5 percent.
The index for recreation and culture recorded a zero annual growth during the month, while those for furnishing, household equipment and routine maintenance of the house; and health both moved at their previous month’s annual growth rates. (Tables 3, and 4)
3. Areas Outside NCR (AONCR)
Inflation in AONCR followed the national trend as it slowed down further to 2.4 percent in September 2020, from 2.5 percent in the previous month. In September 2019, inflation in the area was recorded at 0.9 percent. (Tables A, and 3)
The index of recreation and culture continued its downtrend at an annual rate of -0.7 percent in September 2020. Moreover, annual growth rates eased in the indices of the following commodity groups during the month:
- Food and non-alcoholic beverages, 1.6 percent;
- Alcoholic beverages and tobacco, 13.3 percent;
- Clothing and footwear, 2.0 percent; and
- Furnishing, household equipment and routine maintenance of the house, 3.2 percent.
Meanwhile, annual increases were higher in the indices of housing, water, electricity, gas, and other fuels (1.4%); transport (7.3%); and restaurant and miscellaneous goods and services (2.6%). The annual rate of the index for education moved up by 0.9 percent during the month, from zero annual growth in the previous month. Annual rates in the indices of health and communication remained at 2.7 percent and 0.4 percent, respectively. (Tables 3, and 4).
Compared with their annual growth rates in the previous month, seven regions in AONCR posted slower annual growth rates during the month. Region XI (Davao Region) still registered the lowest inflation at 0.8 percent, while the highest inflation remained in Region V (Bicol Region) at 4.5 percent. (Table 4)
Note: CPIs and inflation rates by province and selected city are posted on the PSA website (http://openstat.psa.gov.ph/).
(Sgd) DENNIS S. MAPA, Ph.D.
Undersecretary
National Statistician and Civil Registrar General
See more at the CPI and Inflation Rate page.

