
Summary Inflation Report Consumer Price Index (2018=100): June 2024
1. Philippines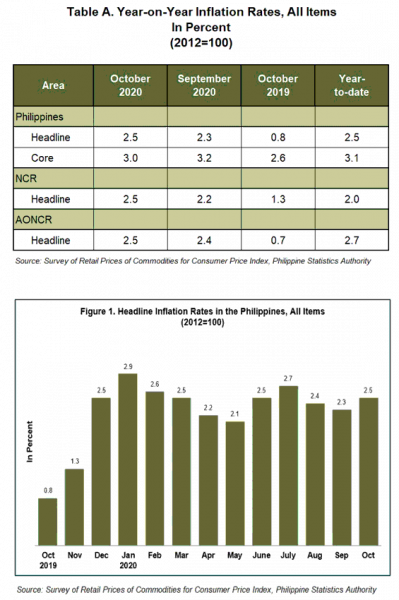
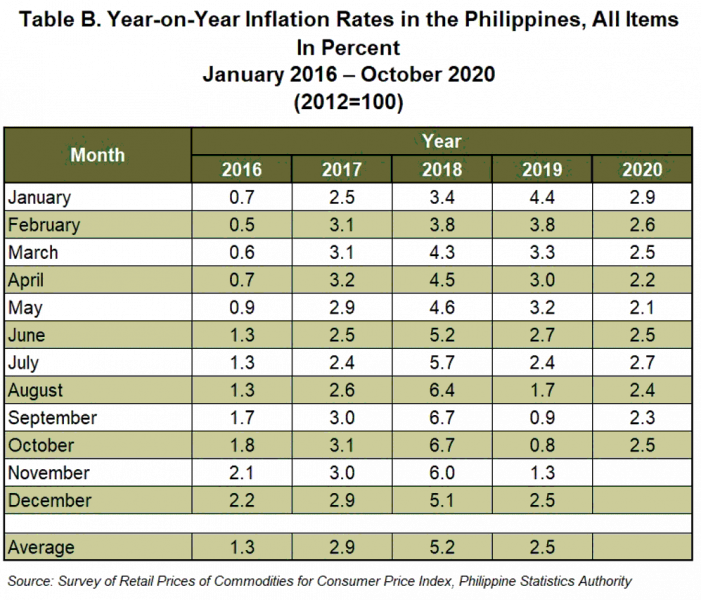
The country’s headline inflation accelerated to 2.5 percent in October 2020, from 2.3 percent in September 2020. In October 2019, inflation was posted at 0.8 percent.
This brings the year-to-date inflation for 2020 at 2.5 percent. (Table A, and Figure 1)
Higher overall inflation was primarily brought about by the increase in the inflation of the heavily-weighted food and non-alcoholic beverages at 2.1 percent during the month, from 1.5 percent in September 2020.
Likewise, annual mark-ups were higher in the indices of education at 1.2 percent, and restaurant and miscellaneous goods and services, 2.4 percent.
On the other hand, slowdowns in the inflation were recorded in the indices of the following commodity groups:
- Alcoholic beverages and tobacco, 11.3 percent;
- Clothing and footwear, 1.7 percent;
- Housing, water, electricity, gas, and other fuels, 0.9 percent;
- Health, 2.7 percent; and
- Transport, 7.9 percent.
The index for recreation and culture was still on a downtrend as its annual rate declined further at -0.6 percent during the month. Meanwhile, the indices for furnishing, household equipment and routine maintenance of the house, and communication retained their previous month’s annual growth rates of 3.7 percent and 0.4 percent, respectively. (Tables 3, and 4)
Core inflation, which excludes selected food and energy items, however, decelerated to 3.0 percent in October 2020, from 3.2 percent in the previous month. In October 2019, core inflation was posted at 2.6 percent. (Tables A and 9)
Inflation for food index at the national level moved up at a faster pace of 2.1 percent during the month after five consecutive months of deceleration. In September 2020, inflation for food was registered at 1.5 percent, and in October 2019, it dropped at -1.3 percent. (Table 7)
Higher inflation in the country’s food index was mainly caused by the jump in the inflation of the meat index at 4.7 percent during the month, from 2.9 percent in September 2020. Annual rates of increments were also higher in the indices of fish, and oils and fats at 3.7 percent and 2.5 percent, respectively. Meanwhile, annual increases were slower in the indices of the following food groups:
- Other cereals, flour, cereal preparation, bread, pasta and other bakery products, 2.2 percent;
- Milk, cheese, and egg, 2.2 percent;
- Fruits, 4.6 percent;
- Sugar, jam, honey, chocolate, and confectionery , 0.2 percent; and
- Food products, not elsewhere classified, 4.8 percent.
The other food groups such as rice, corn, and vegetables continued to register negative annual rates during the month. (Table 5)
2. National Capital Region (NCR)
Inflation in NCR, likewise, went up to 2.5 percent in October 2020, from 2.2 percent in September 2020. In October 2019, inflation in the area stood at 1.3 percent. (Tables A, and 3)
The annual increment of 2.6 percent in the index of food and non-alcoholic beverages primarily pushed up the inflation in NCR. Also contributing to the uptrend were the higher annual rates of mark-ups observed in the indices of housing, water, electricity, gas, and other fuels at 0.7 percent, and restaurant and miscellaneous goods and services, 1.6 percent.
The annual rate in the index for recreation and culture declined by -0.1 percent during the month, from zero annual growth in the previous month. The remaining commodity groups either had slower annual gains or retained their previous month’s annual growth rates. (Tables 3, and 4)
3. Areas Outside NCR (AONCR)
Similar to the trend of the national level and NCR, inflation in AONCR picked up by 2.5 percent during the month, from 2.4 percent in September 2020. In October 2019, inflation in AONCR was recorded at 0.7 percent. (Tables A, and 3)
Annual increases were higher in the indices of food and non-alcoholic beverages at 2.0 percent; education, 1.4 percent; and restaurant and miscellaneous goods and services, 2.7 percent.
Other commodity groups posted slower annual growth rates during the month, except for the indices of recreation and culture which went down further by -0.9 percent, and communication which retained its previous month’s annual rate of 0.4 percent.
Compared with their annual growth rates in September 2020, seven regions in AONCR recorded higher inflation during the month. Region V (Bicol Region) still had the highest inflation in October 2020 at 4.1 percent, while Region VII (Central Visayas) exhibited the lowest inflation at 1.3 percent. (Table 4)
Note: CPIs and inflation rates by province and selected city are posted on the PSA website (http://openstat.psa.gov.ph/).
(Sgd) DENNIS S. MAPA, Ph.D.
Undersecretary
National Statistician and Civil Registrar General
See more at the CPI and Inflation Rate page.

