
Summary Inflation Report Consumer Price Index (2018=100): June 2024
1. Philippines
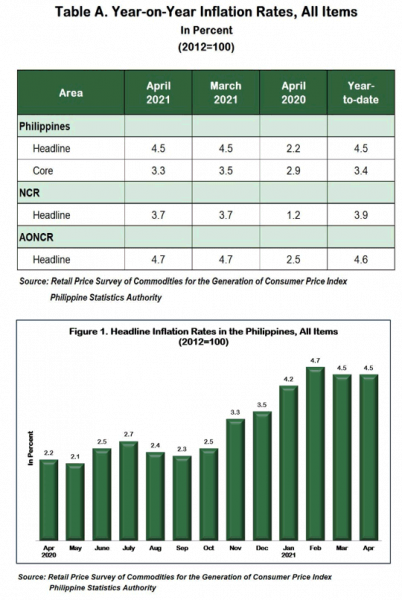
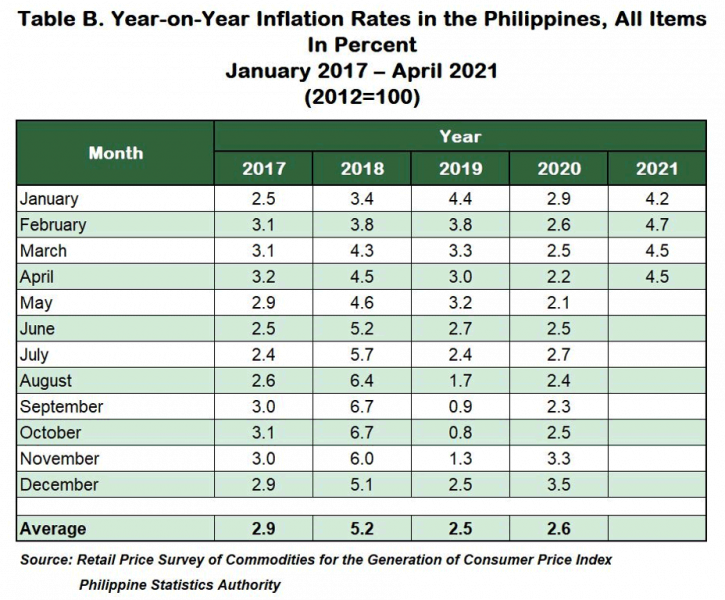
Headline inflation at the country level was posted at 4.5 percent in April 2021, the same annual growth rate recorded in March 2021. This brings the average inflation at the national level from January to April 2021 to 4.5 percent. Meanwhile, inflation in April 2020 was registered at 2.2 percent. (Table A and Figure 1)
Varied annual growth rates in the indices of the commodity groups were observed in April 2021.
Annual increases were higher in the indices of the following commodity groups in April 2021:
- Housing, water, electricity, gas, and other fuels, 1.5 percent;
- Furnishing, household equipment and routine maintenance of the house, 2.1 percent;
- Health, 3.1 percent;
- Transport, 17.9 percent;
- Communication, 0.3 percent; and
- Restaurant and miscellaneous goods and services, 3.4 percent.
On the other hand, inflation slowed down in the indices of food and non-alcoholic beverages at
The rest of the commodity groups retained their respective previous month’s annual growth rates. (Tables 3 and 4)
Excluding selected food and energy items, core inflation decelerated to 3.3 percent in April 2021, from 3.5 percent in the previous month. Core inflation in April 2020 was posted at 2.9 percent.
Inflation for food index at the country level decelerated to 5.0 percent during the month, from
Annual rates went down during the month in the indices of rice and vegetables at -0.3 percent and -2.6 percent, respectively. Moreover, annual hikes slowed down in the indices of other cereals, flour, cereal preparation, bread, pasta and other bakery products at 1.8 percent; milk, cheese and egg, 1.4 percent; fruits, 0.3 percent; and food products not elsewhere classified, 0.5 percent. On the other hand, annual rates picked up further in the indices of corn at 3.1 percent; meat, 22.1 percent; and fish, 6.0 percent. The indices of oils and fats; and sugar, jam, honey, chocolate and confectionery moved at their corresponding previous month’s annual growth rates of 3.9 percent and 0.3 percent. (Table 5)
2. National Capital Region (NCR)
Similarly, inflation in NCR remained at its previous month’s annual rate of 3.7 percent in April 2021. Inflation in the area in April 2020 was noted at 1.2 percent.
Higher annual increments were seen in the indices of clothing and footwear at 0.8 percent; transport, 19.7 percent; and restaurant and miscellaneous goods and services, 1.8 percent. On the other hand, annual increases eased in the indices of the following commodity groups:
- Food and non-alcoholic beverages, 4.9 percent;
- Alcoholic beverages and tobacco, 10.3 percent;
- Housing, water, electricity, gas, and other fuels, 0.2 percent; and
- Furnishing, household equipment and routine maintenance of the house, 0.5 percent.
The rest of the commodity groups retained their previous month’s annual growth rates. (Tables 3 and 4)
3. Areas Outside NCR (AONCR)
The same trend as the national level and NCR was observed in AONCR as inflation in the area at 4.7 percent during the month was the same annual rate recorded in March 2021. In April 2020, inflation in AONCR was posted at 2.5 percent.
Higher annual upticks were observed in the indices of the following commodity groups:
- Housing, water, electricity, gas, and other fuels, 2.0 percent;
- Furnishing, household equipment and routine maintenance of the house, 2.7 percent;
- Health, 3.1 percent;
- Transport, 17.3 percent;
- Communication, 0.4 percent; and
- Restaurant and miscellaneous goods and services, 4.2 percent.
Slower pace of inflation was registered in the index of food and non-alcoholic beverages at 4.8 percent during the month. Other commodity groups moved at their previous month’s annual growth rates. (Tables 3 and 4)
Mixed trends of inflation were observed among the regions in AONCR. The highest inflation of 7.9 percent during the month was still observed in Region V (Bicol Region), while the lowest remained in Central Visayas at 1.9 percent. (Table 4)
Note: CPIs and inflation rates by province and selected city are posted on the PSA website (http://openstat.psa.gov.ph/).
DENNIS S. MAPA, Ph.D.
Undersecretary
National Statistician and Civil Registrar General
See more at the CPI and Inflation Rate page.

