
Summary Inflation Report Consumer Price Index (2018=100): June 2024
1. Philippines
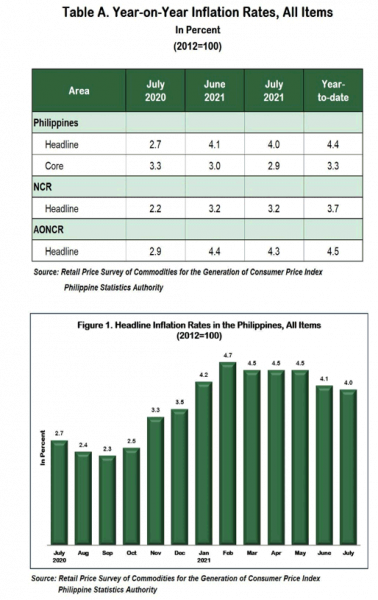
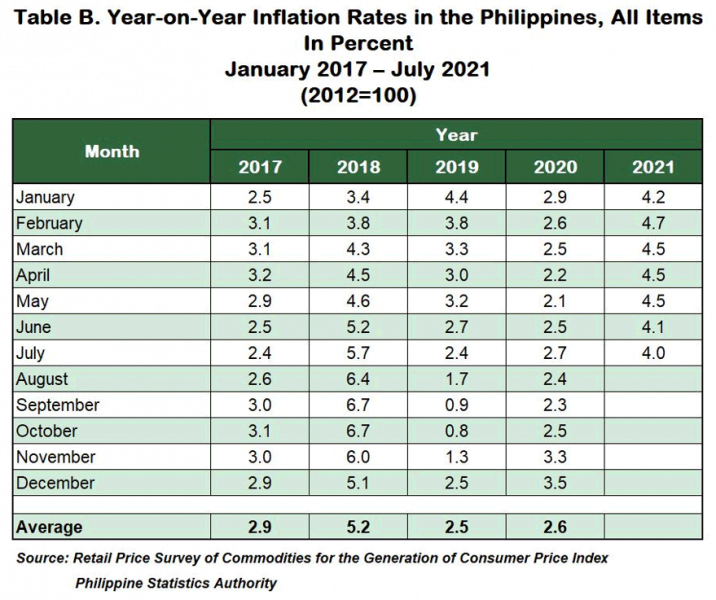
The headline inflation at the national level decelerated further to 4.0 percent in July 2021, from
The main source of the downward trend of the July 2021 inflation was the lower annual increment registered in the transport index at 7.0 percent, from 9.6 percent in the previous month. Contributing also to the downward trend in the overall inflation were the slower annual increases recorded in the indices of the following commodity groups:
- Alcoholic beverages and tobacco, 10.2 percent;
- Furnishing, household equipment and routine household maintenance, 2.3 percent; and
- Restaurant and miscellaneous goods and services, 3.6 percent.
Moreover, the annual rate of recreation and culture index dropped further to -0.7 percent during the month, from -0.6 percent in the previous month.
On the other hand, inflation rates were higher in the indices of the following commodity groups:
- Food and non-alcoholic beverages, 4.9 percent;
- Clothing and footwear, 1.7 percent;
- Housing, water, electricity, gas and other fuels, 2.6 percent;
- Health, 3.1 percent; and
- Communication, 0.3 percent.
The index of education retained its previous month’s annual growth rate of 1.1 percent. (Tables 3 and 4)
Excluding selected food and energy items, core inflation, likewise, slid further to 2.9 percent in July 2021, from 3.0 percent in June 2021. In July 2020, core inflation was observed at 3.3 percent. (Tables A and 9)
Inflation for food index at the national level was higher at 5.1 percent in July 2021, from 4.9 percent in the previous month. In July 2020, inflation for food was posted at 2.5 percent (Table 7).
The annual decline of -1.0 percent in rice index in July 2021 was smaller than its annual drop of -1.1 percent in the previous month. The annual rate of vegetables index also accelerated to 5.0 percent in July 2021, from an annual decrease of -2.7 percent in June 2021. In addition, annual upticks were higher during the month in the indices of corn at 6.4 percent; fish, 9.3 percent; and oils and fats, 4.4 percent.
Meanwhile, annual hikes were slower in the indices of the following food groups:
- Other cereals, flour, cereal preparations, bread, pasta, and other bakery products, 1.7 percent;
- Meat, 16.0 percent;
- Milk, cheese and egg, 0.6 percent; and
- Food products not elsewhere classified, 0.9 percent.
The rest of the food groups retained their previous month’s annual growth rates. (Table 5)
2. National Capital Region (NCR)
Inflation in NCR in July 2021, however, stood at its previous month’s annual rate of 3.2 percent. In July 2020, inflation in the region was posted at 2.2 percent. (Tables A and 3)
Mixed annual growth rates in the indices of commodity groups were observed in July 2021.
Annual hikes were higher in the indices of food and non-alcoholic beverages at 5.5 percent; housing, water, electricity, gas, and other fuels, 1.2 percent; and restaurant and miscellaneous goods and services, 2.9 percent. On the other hand, annual increases were slower in the indices of the following commodity groups:
- Alcoholic beverages and tobacco, 10.5 percent;
- Clothing and footwear, 0.7 percent;
- Health, 2.6 percent; and
- Transport, 4.1 percent
Moreover, annual rate went down further in the index of recreation and culture to -0.7 percent during the month.
The rest of the commodity groups moved at their previous month’s annual growth rates. (Tables 3 and 4).
3. Areas Outside NCR (AONCR)
The same trend as the national level was observed in AONCR as inflation in the area eased further to 4.3 percent in July 2021, from 4.4 percent in June 2021. In July 2020, inflation in AONCR was noted at 2.9 percent.
The slower pace in the inflation in AONCR was mainly brought about by the lower annual rate of increase in the transport index at 7.8 percent during the month, from 11.2 percent in the previous month. Annual increments also decelerated in the indices of alcoholic beverages and tobacco at 10.1 percent; furnishing, household equipment and routine maintenance of the house, 2.6 percent; and restaurant and miscellaneous goods and services, 3.9 percent. In addition, the annual rate of recreation and culture index declined further to -0.7 percent during the month.
On the contrary, annual upticks were higher in the indices of food and non-alcoholic beverages at 4.8 percent; housing, water, electricity, gas, and other fuels, 3.2 percent; and health, 3.2 percent.
The rest of the commodity groups retained their respective previous month’s annual growth rates. (Tables 3 and 4)
Six regions in AONCR exhibited lower inflation during the month. The lowest inflation among the regions in AONCR in July 2021 at 2.0 percent was recorded both in Region VII (Central Visayas) and Bangsamoro Autonomous Region in Muslim Mindanao (BARMM), while the highest inflation of 6.9 percent was seen in Region II (Cagayan Valley). (Table 4)
Note: CPIs and inflation rates by province and selected city are posted on the PSA website (http://openstat.psa.gov.ph/).
DENNIS S. MAPA, Ph.D.
Undersecretary
National Statistician and Civil Registrar General
See more at the CPI and Inflation Rate page.

