
Summary Inflation Report Consumer Price Index (2018=100): June 2024
1. Philippines
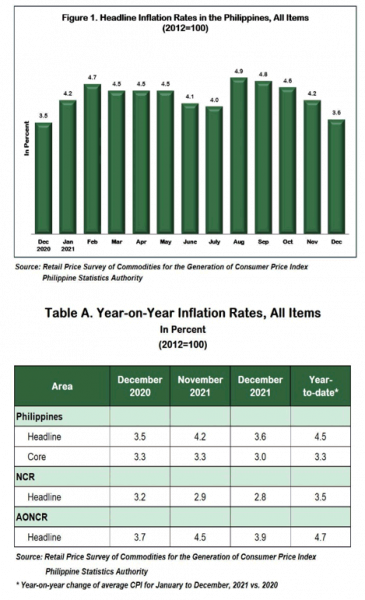
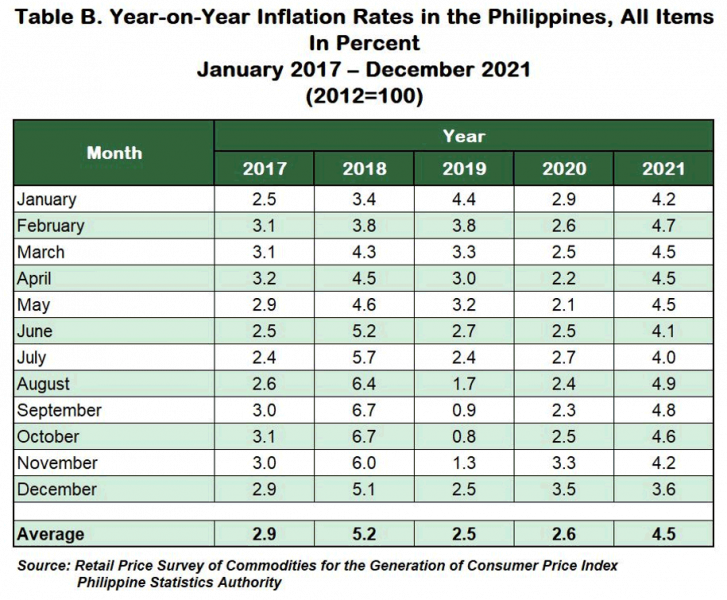
The country’s headline inflation slowed down further to 3.6 percent in December 2021, from 4.2 percent in November 2021. This is the lowest inflation posted for the year 2021.
The average inflation at the national level for the year 2021 at 4.5 percent was higher relative to the average inflation in 2020 at 2.6 percent. (Tables A and B, and Figure 1)
The main source of the downward trend of the December 2021 overall inflation was primarily brought about by the slower annual increase in food and non-alcoholic beverages at 3.1 percent in December 2021, from 3.9 percent in November 2021. Lower inflation recorded in the indices of the following commodity groups also contributed to the downward trend in the overall inflation during the month:
- Alcoholic beverages and tobacco, 6.5 percent;
- Clothing and footwear, 1.8 percent;
- Furnishing, household equipment and routine maintenance of the house, 2.3 percent;
- Health, 3.0 percent;
- Transport, 6.1 percent;
- Recreation and culture, 0.9 percent; and
- Restaurant and miscellaneous goods and services, 3.5 percent.
On the contrary, inflation rates were higher in the indices of housing, water, electricity, gas and other fuels at 5.0 percent, and communication at 0.3 percent.
For three consecutive months now, inflation for education index was posted at 0.7 percent.
Annual average inflation rates in 2021 were higher in the following major commodity groups relative to their annual average inflation in 2020:
- Food and non-alcoholic beverages, 5.2 percent;
- Housing, water, electricity, gas, and other fuels, 2.6 percent;
- Health, 3.0 percent;
- Transport, 9.7 percent; and
- Restaurant and miscellaneous goods and services, 3.6 percent.
On the other hand, other commodity groups exhibited slower annual average inflation or negative annual average rate during the year, except for communication which retained its 2020 annual average rate of 0.3 percent. (Tables 3 and 4A).
Core inflation, which excludes selected food and energy items, also slowed down further to 3.0 percent in December 2021, from 3.3 percent in November 2021. In December 2020, core inflation was observed at 3.3 percent. (Tables A and 9)
The annual average core inflation in 2021 was recorded at 3.3 percent, slightly higher than its 3.2 percent annual average rate in 2020. (Tables A and 9)
Inflation for food at the national level continued to move downward as it decelerated further to 3.2 percent during the month, from 4.1 percent in November 2021. In December 2020, inflation for food was posted at 4.9 percent. (Table 7)
By food group, the annual growth rate of the vegetables index decreased further by -10.0 percent in December 2021. Moreover, annual increases were slower in the indices of rice at 0.9 percent; corn, 14.4 percent; fish, 7.0 percent; and milk, cheese, and eggs at 1.1 percent. The indices of other food groups registered higher annual increments during the month. (Table 5)
2. National Capital Region (NCR)
Inflation in NCR, similarly, moved up at a slower pace of 2.8 percent in December 2021, from 2.9 percent in November 2021. Inflation in the region in December 2020 was observed at 3.2 percent. (Tables A and 3)
The annual average inflation in NCR for the year 2021 was higher at 3.5 percent, from 2.2 percent in 2020. (Tables 3 and 4A)
The deceleration in the inflation in NCR was primarily due to the lower annual rate of increment in transport index at 5.6 percent during the month, from
Meanwhile, annual increases were higher in the indices of housing, water electricity, gas and other fuels at 4.4 percent, and restaurant and miscellaneous goods and services at 2.9 percent. The rest of the commodity groups retained their previous month’s annual rates or had zero percent annual growth during the month. (Tables 3 and 4)
3. Areas Outside NCR (AONCR)
Inflation in AONCR also eased further to 3.9 percent in December 2021, from 4.5 percent in November 2021. In December 2020, inflation in AONCR was observed at 3.7 percent. (Tables A and 3)
The annual average inflation in AONCR accelerated to 4.7 percent in 2021, from 2.7 percent in 2020. (Tables 3 and 4A)
The downtrend in the inflation of AONCR was primarily due to the slower annual rate of increase in food and non-alcoholic beverages index at 3.5 percent during the month. Likewise, annual hikes decelerated in the indices of the following commodity groups:
- Alcoholic beverages and tobacco, 6.4 percent;
- Clothing and footwear, 2.0 percent;
- Furnishing, household equipment and routine maintenance of the house, 2.7 percent;
- Health, 2.8 percent;
- Transport, 6.3 percent;
- Recreation and culture, 1.1 percent; and
- Restaurant and miscellaneous goods and services, 3.6 percent.
On the other hand, inflation for housing, water, electricity, gas, and other fuels was higher at 5.2 percent, while the indices of the rest of the commodity groups retained their previous month’s annual growth rates. (Tables 3 and 4)
Compared with their annual growth rates in November 2021, 13 regions in AONCR exhibited lower inflation during the month. The Bangsamoro Autonomous Region in Muslim Mindanao (BARMM) still recorded the lowest inflation at 2.1 percent, while Region IX (Zamboanga Peninsula) and Region XI (Davao Region) both exhibited the highest inflation at 6.1 percent. (Table 4)
Relative to their 2020 annual average rates, all regions in AONCR had higher annual average inflation in 2021. Region V (Bicol Region) posted the highest annual average inflation during the year at 6.6 percent. On the other hand, Region VII (Central Visayas) had the lowest annual average inflation of 2.5 percent (Table 4A).
Note: CPIs and inflation rates by province and selected city are posted on the PSA website (http://openstat.psa.gov.ph/).
DENNIS S. MAPA, Ph.D.
Undersecretary
National Statistician and Civil Registrar General
See more at the CPI and Inflation Rate page.

