
Summary Inflation Report Consumer Price Index (2018=100): June 2024
Year-on-Year Inflation Rates, All Items | |||
January | December | Year-to-date | |
| Philippines | |||
| Headline | 4.9 | 3.9 | 4.9 |
| Core | 3.4 | 2.6 | 3.4 |
| NCR | |||
| Headline | 3.9 | 3.5 | 3.9 |
| AONCR | |||
| Headline | 5.3 | 4.2 | 5.3 |
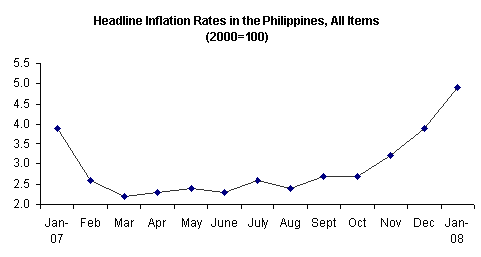
· The beginning of the year 2008 saw a higher year-on-year headline inflation rate in the Philippines at 4.9 percent in January from 3.9 percent in December. This was effected by the higher upward movements in the rates of all the commodity groups. Inflation a year ago was 3.9 percent.
· Similarly, inflation rate in the National Capital Region (NCR) went up to 3.9 percent in January from 3.5 percent in December as higher rates were posted in all the commodity groups except for housing and repairs (H&R) and miscellaneous items.
· Annual inflation rate in Areas Outside the National Capital Region (AONCR) increased to 5.3 percent in January from 4.2 percent in December due to the acceleration in the inflation rates of all the commodity groups.
- Excluding selected food and energy items, core inflation rose to 3.4 percent in January from 2.6 percent in December.
Month-on-Month Inflation Rates, All Items | ||
January | December | |
| Philippines | 1.2 | 0.8 |
| NCR | 0.6 | 1.0 |
| AONCR | 1.4 | 0.7 |
- The month-on-month inflation rate advanced by 1.2 percent in January from 0.8 percent in December brought about by the general upward adjustments in consumer prices.
CONSUMER PRICE INDEX
(2000=100)
JANUARY 2008
By Region, Year-on-Year
- The annual inflation rate in NCR picked up to 3.9 percent in January from 3.5 percent in December.
- Inflation in AONCR jumped to 5.3 percent in January from 4.2 percent in December as all the regions registered higher annual inflation rates. The biggest uptick of 2.9 percentage points was seen in Zamboanga Peninsula (8.6% from 5.7%), the highest inflation rate among the regions. Meanwhile, the lowest rate was in CALABARZON at 4.2 percent.
By Commodity Group, Year-on-Year
- All the commodity groups posted higher annual price increments in January. Inflation for food, beverages and tobacco (FBT) climbed up to 5.9 percent in January from 4.8 percent in December; clothing and H&R, 2.3 percent from their respective last month’s rates of 1.6 percent and 1.1 percent; fuel, light and water (FLW), 5.5 percent from 5.3 percent; services, 5.4 percent from 4.9 percent; and miscellaneous items, 1.6 percent from 1.3 percent.
- The annual inflation rate for food alone in the Philippines rose to 6.2 percent in January from 5.0 percent in December.
- All the food groups continued to register higher annual price increases in January. The annual gain in the price of rice was 7.5 percent in January from 7.2 percent in December; corn, 4.2 percent from 2.4 percent; cereal preparations, 6.8 percent from 5.2 percent; dairy products, 9.8 percent from 8.5 percent; eggs, 8.2 percent from 7.7 percent; fish, 7.0 percent from 4.6 percent; fruits and vegetables, 10.5 percent from 7.5 percent; meat, 3.3 percent from 2.8 percent; and miscellaneous foods, 3.5 percent from 2.9 percent.
- In NCR, the annual rates of price adjustments were higher in all the commodity groups except for H&R and miscellaneous items whose inflation moved at their corresponding December rates of 0.8 percent and 0.7 percent. Inflation for FBT was faster at 5.4 percent in January from 4.7 percent in December; clothing, 2.4 percent from 1.2 percent; FLW, 1.0 percent from 0.7 percent; and services, 7.0 percent from 6.4 percent.
- Inflation rate for food alone in NCR accelerated to 5.6 percent in January from 4.9 percent in December.
- Annual price increment in corn was higher at 17.5 percent in January from 16.9 percent in December; cereal preparations, 7.0 percent from 5.6 percent; dairy products, 8.1 percent from 6.9 percent; fish, 6.4 percent from 2.6 percent; meat, 3.8 percent from 3.2 percent; and miscellaneous foods, 2.5 percent from 2.2 percent. On the other hand, the annual price gain in rice was slower at 10.4 percent from 10.6 percent; eggs, 7.9 percent from 9.3 percent; and fruits and vegetables, 9.0 percent from 9.6 percent.
- In AONCR, higher annual price movements were seen in all the commodity groups. Inflation for FBT soared by 6.2 percent in January from 4.9 percent in December; clothing, 2.2 percent from 1.8 percent; H&R, 3.6 percent from 1.4 percent; FLW, 8.0 percent from 7.8 percent; services, 4.5 percent from 4.2 percent; and miscellaneous items, 1.9 percent from 1.6 percent.
- Measured from a year ago, prices of food alone were up by 6.3 percent in January from 5.0 percent in December as higher annual growth rates were recorded in all the food groups.
- The annual price hike in rice was at 7.1 percent in January from 6.7 percent in December as eleven regions posted higher annual rates. The biggest acceleration of 1.9 percentage points (8.7% from 6.8%) was seen in CALABARZON followed by Eastern Visayas at 1.1 percentage points (6.9% from 5.8%).
- Moreover, the annual price addition also advanced in corn at 3.9 percent in January from 2.2 percent in December; cereal preparations, 6.7 percent from 5.1 percent; dairy products, 10.6 percent from 9.1 percent; eggs, 8.2 percent from 7.2 percent; fish, 7.1 percent from 5.1 percent; fruits and vegetables, 11.0 percent from 6.9 percent; meat, 3.1 percent from 2.5 percent; and miscellaneous foods, 3.9 percent from 3.2 percent.
By Region, Month-on-Month
- Price increments in NCR slowed down to 0.6 percent in January from 1.0 percent in December as lower price movements were noted in FBT at 0.7 percent from 1.6 percent. A slowdown in the upward price adjustments in FLW items at 1.1 percent from 2.5 percent also contributed to the downtrend. However, prices of clothing items moved up to 1.6 percent from 0.1 percent; services items, 0.6 percent from 0.5 percent; and miscellaneous items, 0.2 percent from 0.1 percent. Price hikes in H&R items remained at 0.1 percent.
- Prices in AONCR rose to 1.4 percent in January from 0.7 percent in December. Price increases in FBT items were higher at 1.7 percent in January from 0.8 percent in December; clothing and H&R items, 0.6 percent and 2.2 percent from 0.1 percent; and miscellaneous items, 0.5 percent from 0.2 percent. Movements in the prices of FLW items were however slower at 0.8 percent from 2.9 percent while price add-ons in services items remained at 0.4 percent.
- Higher monthly price gains were registered in thirteen regions during the month. The highest month-on-month inflation at 3.1 percent was noticed in Zamboanga Peninsula while the lowest rate of 0.7 percent was seen in CAR.
- All the regions recorded higher monthly growth rates except for Eastern Visayas and Northern Mindanao whose price uptick were slower during the month and CAR whose index moved at its last month’s rate. Upward price adjustments in Mindanao were generally faster than those in Luzon and Visayas.
By Commodity Group, Month-on-Month
- The year started off with a higher month-on-month inflation of 1.2 percent in January from 0.8 percent in December as growths in all the commodity groups moved at faster rates except for FLW items whose price additions were slower at 0.9 percent from 2.8 percent. Prices of the heavily weighted FBT items rose to 1.4 percent in January from 0.9 percent in December; clothing and H&R items, 0.9 percent and 1.3 percent from 0.1 percent; and services and miscellaneous items, 0.5 percent from their respective last month’s rates of 0.4 percent and 0.2 percent.
- With the uptick in the prices of flour and flour products, the index of cereal preparations went up to 1.7 percent in the Philippines, 1.6 percent in NCR and 1.8 percent in AONCR. These were higher than their corresponding previous month’s growth rates of 0.9 percent, 1.1 percent and 0.8 percent.
- After the holiday season, consumer’s preference shifted from meat to fish. Thus, the bigger demand for fish products caused their prices to increase. In addition, prices of fish were also up due to limited supply brought about by the difficulty in catching fish that usually settle deep in the waters during the cold months. The group’s index in the Philippines posted a higher growth rate of 3.4 percent in January from 1.6 percent in December; NCR, 4.7 percent from 3.5 percent; and AONCR, 3.1 percent from 1.2 percent. Add-ons in the prices of canned fish also contributed to the uptrend.
- The tight supply of onions in the markets significantly raised their prices during the month. Prices of lowland grown vegetables were also higher as consumers preferred more of these vegetables after the holidays. These factors along with the price hikes of selected fruits in the markets in most of the regions resulted to the 3.2 percent and 4.5 percent in the respective growth rates in the indices of fruits and vegetables in the Philippines and AONCR. On the contrary, bigger volume of supplies of selected vegetables coming from CAR pushed down their prices in the NCR markets by -0.8 percent. Lower prices of some fruits in NCR were also noted.
- Price gains in meat and meat products in NCR improved to 0.1 percent from 0.9 percent as consumer demand slowed down after the holiday season. On the other hand, higher price movements in meat were correspondingly posted in the Philippines and AONCR at 0.8 percent and 1.1 percent from previous month’s growth rates of 0.7 percent and 0.6 percent, respectively.
- Upward adjustments in the prices of coffee, cooking oil and selected spices and seasonings in many regions including NCR pulled up the index of miscellaneous foods in the Philippines by 0.6 percent; NCR, 0.3 percent; and AONCR, 0.8 percent.
- The price of rice in NCR was generally stable as its index posted a zero growth during the month from -0.1 percent. However, the rice indices in AONCR and in the Philippines were correspondingly higher at 0.7 percent and 0.8 percent from 0.1 percent.
- With higher rental rates and additions in the prices of selected construction materials in many regions including NCR, the H&R index in the Philippines went up by 1.3 percent, NCR, 0.1 percent and AONCR, 2.2 percent.
- Increments in the prices of firewood, charcoal, LPG and kerosene in selected regions resulted to the 0.8 percent growth in the FLW index in AONCR and 0.9 percent in the Philippines. The FLW index in NCR likewise moved up by 1.1 percent due to the acceleration in the prices of LPG and kerosene. Higher charges in electricity and water rates in the area were also noted.
- The increase in charges on selected personal services in NCR and in some regions pushed the services index in the Philippines by 0.5 percent; NCR, 0.6 percent; and AONCR, 0.4 percent.
NOTE: CPIs and inflation rates by province and selected city are also available upon request at NSO, Industry and Trade Statistics Department, Economic Indices and Indicators Division (Telephone Numbers: 716-39-35 and 715-33-47).
(Sgd.) CARMELITA N. ERICTA |
Source: National Statistics Office
Manila, Philippines

