
Summary Inflation Report Consumer Price Index (2018=100): June 2024
Year-on-Year Inflation Rates, All Items | |||
| September | August | Year-to-date | |
| Philippines | |||
| Headline | 5.7 | 6.3 | 6.8 |
| Core | 5.0 | 5.3 | 5.8 |
| NCR | |||
| Headline | 6.2 | 6.9 | 7.5 |
| AONCR | |||
| Headline | 5.5 | 6.0 | 6.5 |
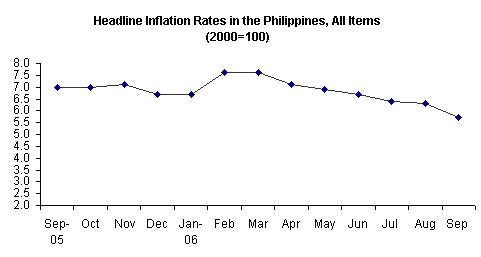
The year-on-year headline inflation rate at the national level continued to slowdown as it registered a rate of 5.7 percent in September from 6.3 percent in August. This was due to the slower annual price increases in all the commodity groups except for clothing. The figure was the lowest inflation rate since June 2004 (5.4%). Inflation a year ago was 7.0 percent.
Excluding selected food and energy items, core inflation further decelerated to 5.0 percent in September from 5.3 percent in August.
Likewise, the annual inflation rate in the National Capital Region (NCR) posted at 6.2 percent in September was also slower from its August’s rate of 6.9 percent.
Inflation rate in Areas Outside the National Capital Region (AONCR) improved to 5.5 percent in September from 6.0 percent in August brought about by the downward trend in the annual price increments of all the commodity groups.
Month-on-Month Inflation Rates, All Items | ||
| September | August | |
| Philippines | -0.1 | 0.4 |
| NCR | -0.4 | 0.1 |
| AONCR | 0.0 | 0.5 |
Reductions in the prices of the heavily weighted food items particularly vegetables, sea foods, chicken and pork primarily triggered the 0.1 percent decline in the overall price movements in September compared to a 0.4 percent growth in August. The nationwide price decreases in gasoline and diesel also contributed to the downtrend. This was the lowest month-on-month inflation rate since February 2002 (-0.2%).
CONSUMER PRICE INDEX
(2000=100)
SEPTEMBER 2006
l By Region, Year-on-Year
Annual inflation rate in NCR also slowed to 6.2 percent in September from 6.9 in August.
Similarly, inflation rate in AONCR improved by 0.5 percentage point to 5.5 percent in September from 6.0 percent in August as the annual inflation rates in all the regions moved down. The biggest slowdown of 1.1 percentage points was observed in Ilocos (5.5% from 6.6%). Western Visayas had still the lowest inflation rate at 3.4 percent while the highest inflation rate of 8.6 percent was still noticed in ARMM.
l By Commodity Group, Year-on-Year
Measured from a year ago, inflation rates for all the commodity groups decelerated except for clothing whose inflation remained at 3.1 percent for three consecutive months. Inflation for FBT was slower at 4.9 percent in September from 5.6 percent in August; housing and repairs (H&R), 3.7 percent from 3.8 percent; fuel, light and water (FLW), 12.9 percent from 13.0 percent; services, 7.7 percent from 9.0 percent; and miscellaneous items, 2.8 percent from 3.0 percent.
The overall inflation rate for food alone went down by 0.6 percentage point to 4.9 percent in September from 5.5 percent in August.
Slower annual price increase was noted in rice at 1.2 percent in September from 1.9 percent in August; cereal preparations, 5.5 percent from 5.7 percent; dairy products, 5.9 percent from 6.0 percent; fish, 5.1 percent from 6.3 percent; fruits and vegetables, 8.2 percent from 11.6 percent; and meat, 1.9 percent from 2.2 percent. However, annual price increments were correspondingly higher in corn and eggs at 7.2 percent and 6.1 percent from their respective last month’s rates of 5.1 percent and 5.9 percent. Inflation for miscellaneous foods still moved at its July rate of 7.8 percent.
In NCR, the annual rates of price additions in FBT items were lower at 5.4 percent in September from 6.5 percent in August; H&R items, 4.0 percent from 4.1 percent; services items, 8.5 percent from 10.3 percent; and miscellaneous items, 2.6 percent from 2.7 percent. Meanwhile, inflation for clothing and FLW were correspondingly higher at 3.2 percent and 12.4 percent from 2.5 percent and 11.2 percent, respectively.
The inflation rate for food alone in NCR eased to 5.6 percent in September from 6.6 percent in August.
Annual upward adjustment in the price of rice decelerated to 0.9 percent in September from 1.0 percent in August; dairy products, 6.5 percent from 6.6 percent; fish, 3.5 percent from 6.0 percent; fruits and vegetables, 7.0 percent from 15.7 percent; and meat, 2.5 percent from 2.8 percent. On the other hand, higher annual price hike was noticed in corn at 0.5 percent from -0.4 percent; eggs, 11.9 percent from 11.5 percent; and miscellaneous foods, 8.6 percent from 8.1 percent. Annual price gain in cereal preparations was still at 6.3 percent.
In AONCR, inflation rates for all the commodity groups in September moved at slower pace compared to their respective August rates. FBT (4.7% from 5.3%); clothing (3.1% from 3.2%); H&R (3.3% from 3.6%); FLW (13.2% from 14.0%); services (7.3% from 8.2%); and miscellaneous items, (3.0% from 3.1%).
Inflation for food alone in AONCR further slackened to 4.7 percent in September from 5.2 percent in August.
The annual price increase in rice continued to slid at 1.2 percent in September from 2.1 percent in August. Slower and negative annual growth rates were recorded in the regions except in CALABARZON, Bicol and Caraga. The biggest decrease of 2.4 percentage points was noted in Ilocos (0.2% from 2.6%) and Zamboanga Peninsula (2.1% from 4.5%). Moreover, annual price add-ons in cereal preparations were lower at 5.3 percent from 5.4 percent; dairy products, 5.7 percent from 5.8 percent; fish, 5.4 percent from 6.3 percent; fruits and vegetables, 8.6 percent from 10.4 percent; meat, 1.7 percent from 1.9 percent; and miscellaneous foods, 7.4 percent from 7.6 percent. On the contrary, faster annual price hike was recorded in corn at 7.3 percent from 5.3 percent while the annual growth rate of eggs remained at 4.3 percent.
l By Region, Month-on-Month
Prices in NCR dropped by -0.4 percent in September from a 0.1 percent growth in August primarily due to the 0.6 percent decrease in the prices of FBT items. Prices of FLW items continued to post negative rate of change at -0.3 percent in September from -4.7 percent in August. In addition, prices of services items also declined by -0.9 percent from 0.5 percent. Meanwhile, prices of clothing and miscellaneous items respectively picked up to 0.7 percent and 0.1 percent from zero growth. Prices of H&R items remained stable as its group’s index registered zero growth.
Prices in AONCR generally remained stable as its overall index posted a zero growth in September from 0.5 percent in August. Prices of H&R items also recorded a zero growth from 0.4 percent. Moreover, reductions in the prices of FBT and services items were correspondingly registered at -0.1 percent and -0.2 percent from 0.6 percent and 0.3 percent, respectively. On the other hand, price hikes in FLW items were slower at 0.2 percent from 1.2 percent while increases in the prices of clothing and miscellaneous items were still at 0.2 percent. The lowest month-on-month rate at -0.3 percent was seen in Ilocos, Western Visayas and Zamboanga Peninsula while MIMAROPA had the highest rate at 0.4 percent.
l By Commodity Group, Month-on-Month
Compared with August 2006, the general level of consumer prices dropped to -0.1 percent in September from 0.4 percent. This was effected by the decreases in the prices of heavily weighted FBT items and services items at -0.2 percent and -0.5 percent respectively from their corresponding previous month’s rates of 0.8 percent and 0.4 percent. Lower price increments in miscellaneous items at 0.1 percent from 0.2 percent also contributed to the downtrend. Prices of H&R and FLW items also remained stable during the month in review as their group’s indices posted zero growth from their respective last month rates of 0.3 percent and -1.0 percent. However, the movement in the prices of clothing items was higher at 0.3 percent from 0.2 percent.
The index of fruits and vegetables in the Philippines dropped by -1.1 percent from 3.6 percent; NCR, -3.8 percent from 7.7 percent; and AONCR, -0.2 percent from 2.3 percent. This was triggered by the reductions of prices of vegetables due to its sufficient supply in the wet markets.
Price declines in shells and mollusks in NCR along with the downward price adjustments in selected fresh fish species in the area, coupled with cheaper shrimps and crabs in many regions including in the NCR brought down the fish index in the three areas: Philippines (-0.8% from 0.4%); NCR (-3.1% from -0.3%); and AONCR (-0.3% from 0.6%).
The sufficient supply of rice brought about by the harvests of palay in selected regions correspondingly pulled down the group’s index in the national level and AONCR at -0.4 percent and -0.5 percent from 0.2 percent. In NCR, the price of rice generally remained stable as its index posted a zero growth from 0.2 percent.
Prices of chicken and pork in selected regions including NCR were lower during the month. Thus, the meat index in the Philippines dipped by -0.3 percent from 0.7 percent; NCR, -0.7 percent from 1.1 percent; and AONCR, -0.2 percent from 0.5 percent.
Higher prices of meals eaten outside the home in selected regions including NCR along with the price hikes in coffee, margarine and cooking oil raised the miscellaneous foods index in the Philippines by 0.3 percent; NCR, 0.7 percent; and AONCR, 0.2 percent.
The series of price cuts in gasoline and diesel mainly effected a decrease in the services index in the three areas: Philippines (-0.5% from 0.4%); NCR (-0.9% from 0.5%); and AONCR (-0.2% from 0.3%).
Uptick in the prices of selected items for household furnishings and operations and personal effects slightly pushed up the miscellaneous items index in the Philippines and NCR by 0.1 percent and in AONCR, 0.2 percent.
Upward price adjustments of selected footwear and ready-made apparel were noted in many regions including NCR. Higher sewing charges in some regions were also recorded during the month. Thus, the clothing index in the Philippines gained 0.3 percent; NCR, 0.7 percent; AONCR, 0.2 percent.
Lower electricity rates and downward price adjustment in kerosene in NCR caused its FLW index to decline by -0.3 percent. On the other hand, the group’s index in AONCR went up by 0.2 percent due to higher prices of LPG and coconut and wood charcoal. This was however slower than its last month’s rate of 1.2 percent. This offsetting trend resulted to a zero growth in the national index of FLW.
NOTE: CPIs and inflation rates by province and selected city are also available upon request at NSO, Industry and Trade Statistics Department, Economic Indices and Indicators Division (Telephone Numbers: 716-39-35 and 715-33-47, email address: r.staana@census.gov.ph).
| (Sgd.) CARMELITA N. ERICTA Administrator |

