
General Retail Price Index in the National Capital Region (2012=100) : May 2024
General Retail Price Index (GRPI)
In the National Capital Region (NCR)
(2012=100)
APRIL 2020
Table A. Year-on-Year Changes of GRPI for All Items, in Percent
(2012=100)
|
|
|
|
|---|---|---|---|
| 0.7 | 1.1 | 2.7 | 1.2 |
Figure 1. Annual Growth Rate of GRPI for All Items
April 2019 - April 2020
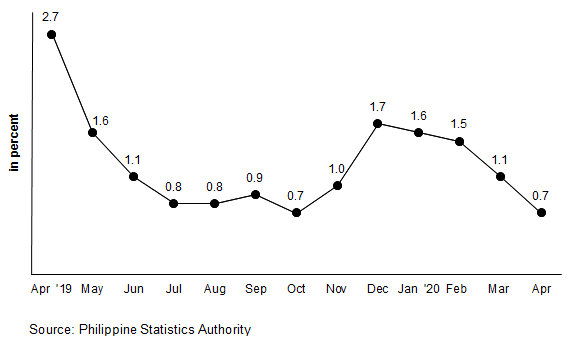
GRPI in NCR continues to move up at slower pace in April 2020
The annual rate of increase of GRPI in NCR slowed down further to 0.7 percent in April 2020. Its annual rate in the previous month was registered at 1.1 percent and in April 2019, 2.7 percent. (Table A and Table 2)
The annual change of mineral fuels, lubricants and related materials index dropped further at 19.0 percent in April 2020. In addition, annual increases decelerated in the indices of machinery and equipment at 0.002 percent and miscellaneous manufactured articles, 1.0 percent.
Moreover, higher annual increments were noted in the indices of food at 2.2 percent; crude materials, inedible except fuels, 1.8 percent; and chemicals including animal and vegetable oils and fats, 1.0 percent.
Furthermore, the indices of other commodity groups such as beverages and tobacco, and manufactured goods classified chiefly by materials retained their previous month annual growth rates of 3.6 percent and 1.4 percent, respectively. (Table 2)
See more at the General Retail Price Index Main page.