
General Retail Price Index in the National Capital Region (2012=100) : May 2024
Table A. Year-on-Year Growth Rates of the GRPI in NCR, All Items
In Percent
(2012=100)
| 2.0 | 2.2 | 2.7 | 2.2 |
Source: Retail Price Survey of Selected Commodities for the Generation of Retail Price Index,
Philippine Statistics Authority
Figure 1. Growth Rates of the GRPI in NCR, All Items
March 2021 - March 2022
(2012=100)
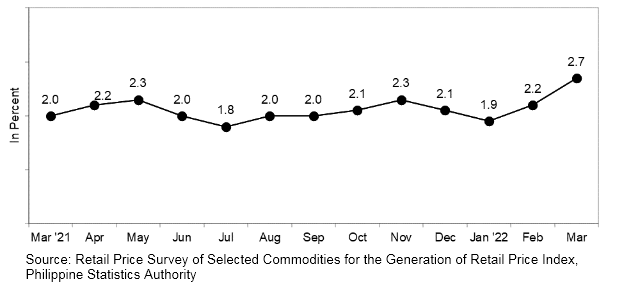
GRPI in NCR increases further in March 2022
The year-on-year change of GRPI in NCR picked up by 2.7 percent in March 2022, from 2.2 percent in February 2022. Its annual change in March 2021 was recorded at 2.0 percent. (Tables A and 2)
The uptrend was mainly due to the higher annual increment in the mineral fuels, lubricants and related materials index at 26.4 percent, from 20.5 percent in the previous month. This was followed by food with an annual rise of 2.5 percent during the month, from 2.1 percent in March 2022.
In addition, annual hikes were also higher in the indices of the following commodity groups:
a. Beverages and tobacco, 2.9 percent;
b. Chemicals, including animal and vegetable oils and fats, 1.7 percent;
c. Manufactured goods classified chiefly by materials, 2.0 percent; and
d. Miscellaneous manufactured articles, 0.7 percent.
On the other hand, the annual increase in the index of machinery and transport equipment decelerated to 0.5 percent. During the same period, the index for crude materials, inedible except fuels had no annual increase. (Table 2)
See more at the General Retail Price Index Main page.