
Rice and Corn Stocks Inventory, June 2024
RICE
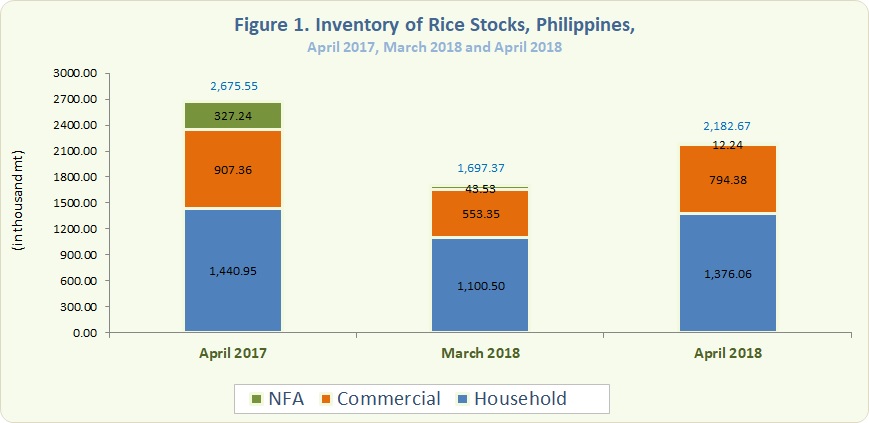
- As of 01 April 2018, total rice stocks inventory was estimated at 2,182.67 thousand metric tons (Figure 1). The volume of stocks was 18.42 percent below last year's inventory level of 2,675.55 thousand metric tons and 28.59 percent higher than the previous month's record of 1,697.37 thousand metric tons (Table 1).
- Comparisons with last year's rice stock levels showed a decrease of 4.50 percent in the households, 12.45 percent in commercial warehouses, and 96.26 percent in NFA depositories (Table 1).
- Relative to last month's record, both stocks inventory level in households and in commercial warehouses grew by 25.04 percent and 43.56 percent, respectively. Meanwhile, a drop in stocks level was observed in NFA depositories by 71.89 percent (Table 1).
- Of the current rice stock level, around 63.04 percent were from the households, 36.39 percent from commercial warehouses, and 0.56 percent from NFA depositories. The latter comprised about 79.69 percent of the imported rice.
CORN
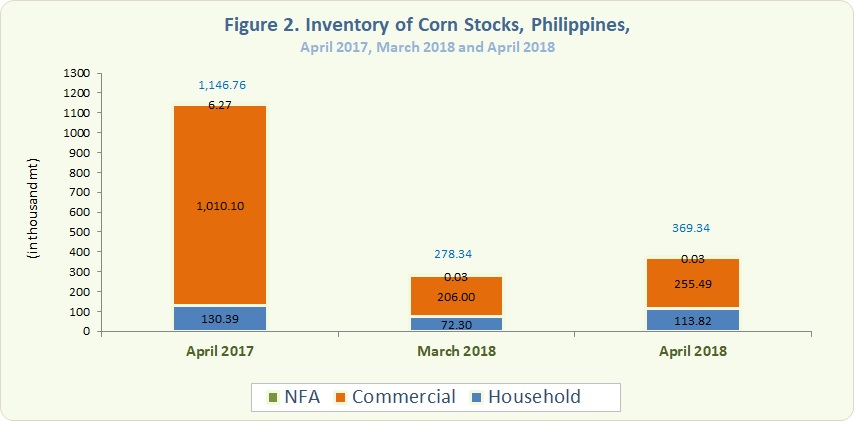
- The country's total corn stocks inventory level as of 01 April 2018 reached 369.34 thousand metric tons (Figure 2). It surpassed last month's level of 278.34 thousand tons by 32.70 percent. However, it was below previous year's level of 1,146.76 thousand metric tons by 67.79 percent (Table 2).
- Comparative estimates with the stocks of last year showed decreases in all sectors. A decline of 12.71 percent, 74.71 percent, and 99.52 percent were observed in the households, commercial warehouses and NFA depositories, respectively (Table 2).
- This month’s stocks level at both households and commercial warehouses went up by 57.42 percent and 24.02 percent respectively, compared to the previous month (Table 2).
- About 30.82 percent of this month's total corn stocks inventory level were from the households, 69.18 percent from commercial warehouses, and 0.01 percent were from NFA depositories.
ROMEO S. RECIDE
Assistant Secretary
Deputy National Statistician
Sectoral Statistics Office
Technical Notes
Monthly rice and corn stocks inventory are generated from three sectors, namely: household, commercial, and National Food Authority (NFA). The household stocks are taken from the Palay and Corn Stocks Survey (PCSS) of the PSA, which covers farming and non-farming households nationwide. The commercial stocks are sourced from registered grains businessmen through the Commercial Stocks Survey (CSS), conducted by the NFA, the results of which are submitted to PSA. NFA stocks are monitored from their warehouses/depositories.