
Rice and Corn Stocks Inventory, June 2024
RICE
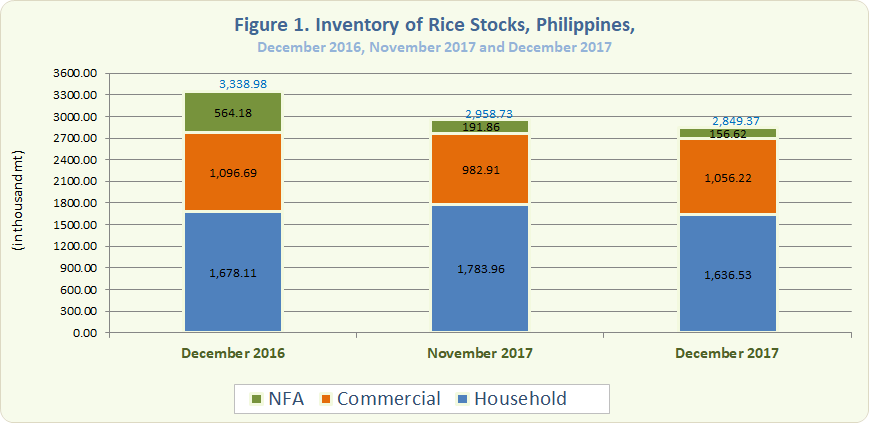
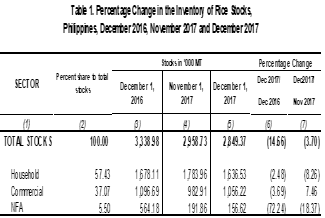
- As of 01 December 2017, the total rice stocks inventory was 2,849.37 thousand metric tons as shown in Figure 1. It was 14.66 percent lower in comparison to the December 2016 inventory level of 3,338.98 thousand metric tons and 3.70 percent lower than the previous month inventory level of 2,958.73 thousand metric tons (Table 1).
- Year-to-year, rice stocks inventory level dropped to 2.48 percent in the households, 3.69 percent in commercial warehouses, and 72.24 percent in NFA depositories (Table 1).
- With reference to the previous month, an increase of 7.46 percent of rice stocks inventory level was seen in commercial warehouses. However, stocks in both the households and NFA depositories decreased, by 8.26 percent and 18.37 percent, respectively (Table 1).
- Of this month’s total rice stock inventory, about 57.43 percent were from the households, 37.07 percent were from commercial warehouses, and 5.50 percent came from NFA depositories. The latter comprised 92.58 percent of the imported rice.
- The total rice inventory for this month would be adequate for 84 days. Stocks would be sufficient for 48 days in the households, 31 days in commercial warehouses, and 5 days in NFA depositories.
CORN
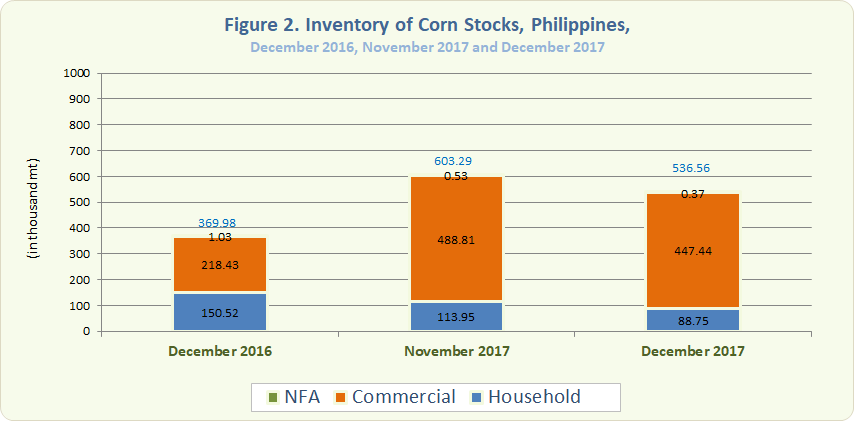
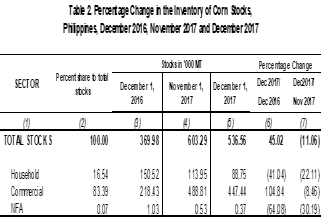
- As of 01 December 2017, the total corn stocks inventory was 536.56 thousand metric tons as shown in Figure 2. It was 45.02 percent greater in comparison to the December 2016 inventory level of 369.98 thousand metric tons and 11.06 percent lower than the previous month’s inventory level of 603.29 thousand metric tons (Table 2).
- In comparison to the previous year, corn stocks inventory level grew by 104.84 percent in commercial warehouses. However, both corn stocks inventory level in the households and in NFA depositories dropped by 41.04 percent and 64.08 percent, respectively (Table 2).
- Month-to-month, corn stocks inventory level decreased by 22.11 percent in the households, 8.46 percent in the commercial warehouses, and 30.19 percent in the NFA depositories (Table 2).
- Of this month’s total corn stock inventory, about 16.54 percent were from the households, 83.39 percent were from the commercial warehouses, and 0.07 percent came from the NFA depositories.
ROMEO S. RECIDE
Assistant Secretary
Deputy National Statistician
Sectoral Statistics Office
Technical Notes
Monthly rice and corn stocks inventory are generated from three sectors, namely: household, commercial, and National Food Authority (NFA). The household stocks are taken from the Palay and Corn Stocks Survey (PCSS1) of the PSA, which covers farming and non-farming households nationwide. The commercial stocks are sourced from registered grains businessmen through the Commercial Stocks Survey (CSS), conducted by the NFA, the results of which are submitted to PSA. NFA stocks are monitored from their warehouses/depositories.