
Rice and Corn Stocks Inventory, June 2024
RICE
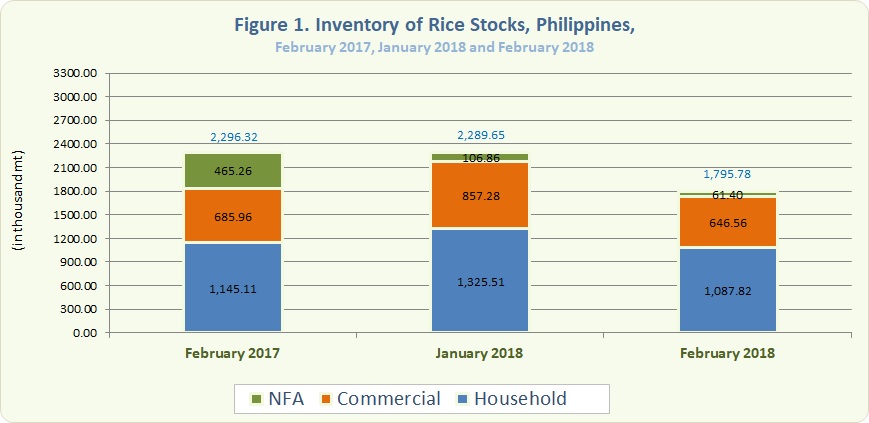
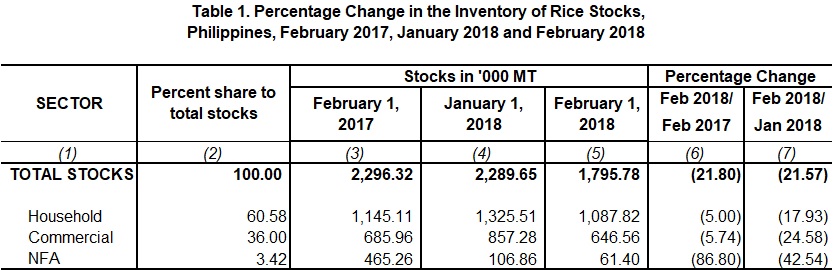
- As of 01 February 2018, the total rice stocks inventory was 1,795.78 thousand metric tons (Figure 1). It decreased by 21.80 percent compared to the February 2017 inventory level of 2,296.32 thousand metric tons. Similarly, a decline of 21.57 percent was observed from the previous month's level of 2,289.65 thousand metric tons (Table 1).
- Year-on-year, rice stocks inventory level dropped in the households, commercial warehouses and NFA depositories by 5.00 percent, 5.74 percent and 86.80 percent, respectively (Table 1).
- With reference to the previous month's rice stocks inventory level, a decrease of 17.93 percent was observed in the households, 24.58 percent in commercial warehouses and 42.54 percent in NFA depositories (Table 1).
- Of this month's total rice stocks inventory, about 60.58 percent were from the households, 36.00 percent from commercial warehouses, and 3.42 percent from NFA depositories. The latter comprised 87.95 percent of the imported rice.
- The total rice inventory for this month would be sufficient for 53 days.
CORN
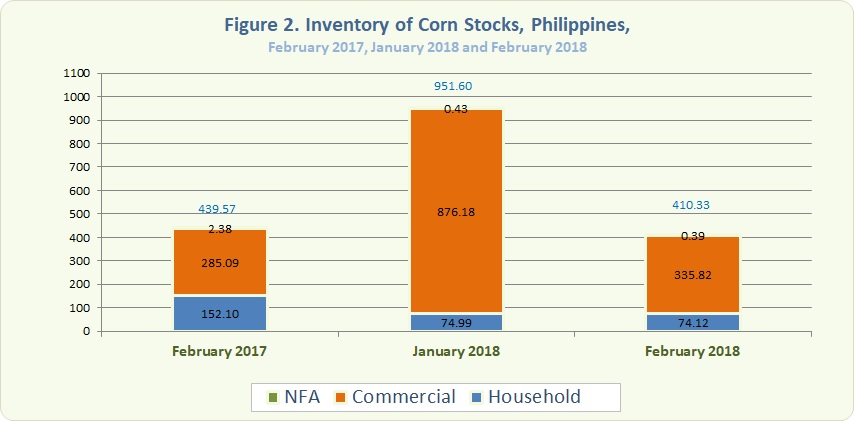
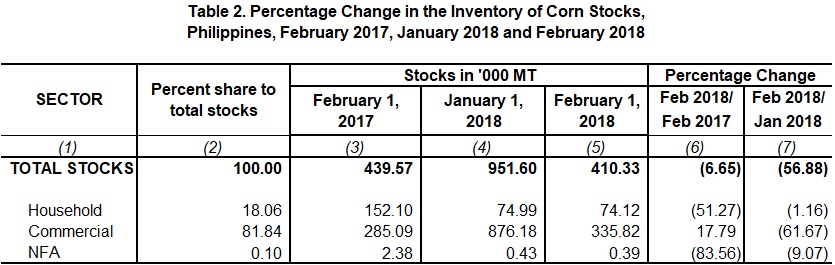
- The total corn stocks inventory level as of 01 February 2018 was 410.33 thousand metric tons (Figure 2). It was lower by 6.65 percent than the previous year's inventory level of 439.57 thousand metric tons and 56.88 percent lower compared to the previous month's inventory level of 951.60 thousand metric tons (Table 2).
- Corn stocks both in the households and NFA depositories decreased in comparison to their levels in the previous year. Stocks dropped by 51.27 percent in the households and 83.56 percent in NFA depositories. However, an increase of 17.79 percent was recorded in commercial warehouses (Table 2).
- Compared with the previous month, corn stocks inventory level in all sectors decreased. Stocks dropped by 1.16 percent in the households, 61.67 percent in commercial warehouses and 9.07 percent in NFA depositories (Table 2).
- About 18.06 percent of this month's total corn stocks inventory level were from the households, 81.84 percent from commercial warehouses and 0.10 percent were from the NFA depositories.
ROMEO S. RECIDE
Assistant Secretary
Deputy National Statistician
Sectoral Statistics Office
Technical Notes
Monthly rice and corn stocks inventory are generated from three sectors, namely: household, commercial, and National Food Authority (NFA). The household stocks are taken from the Palay and Corn Stocks Survey (PCSS) of the PSA, which covers farming and non-farming households nationwide. The commercial stocks are sourced from registered grains businessmen through the Commercial Stocks Survey (CSS), conducted by the NFA, the results of which are submitted to PSA. NFA stocks are monitored from their warehouses/depositories.