
Rice and Corn Stocks Inventory, June 2024
RICE
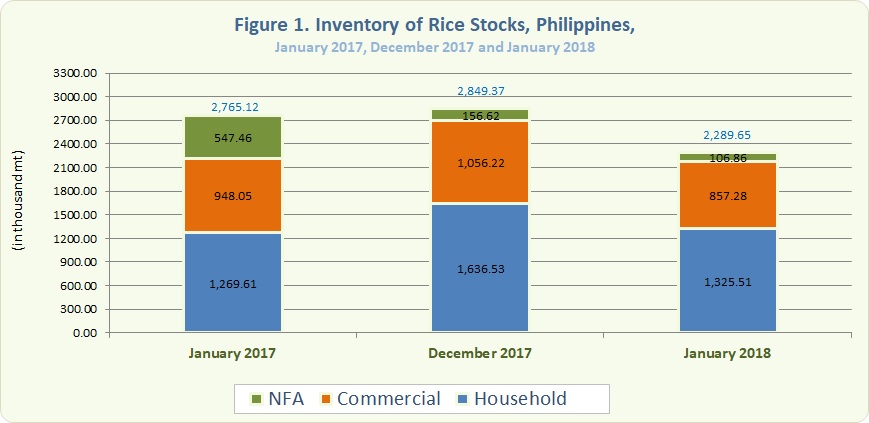
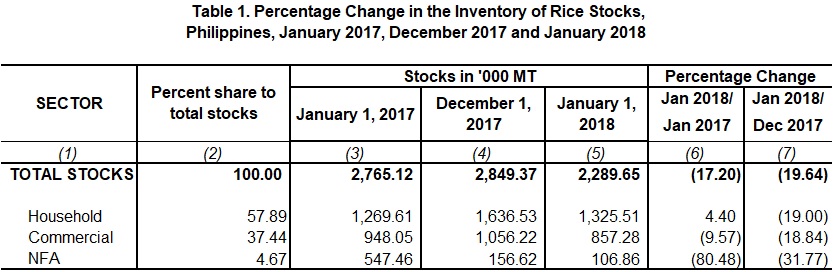
- The total rice stocks inventory as of 01 January 2018 was 2,289.65 thousand metric tons (Figure 1). This was lower by 17.20 percent from the 2,765.12 thousand metric tons inventory level in January 2017. Similarly, it declined by 19.64 percent from the previous month’s level of 2,849.37 thousand metric tons (Table 1).
- Relative to the previous year, rice stocks inventory level increased by 4.40 percent in the households. However, stocks from both commercial warehouses and NFA depositories dropped by 9.57 percent and 80.48 percent, respectively (Table 1).
- In comparison to the previous month, a decline in rice stocks inventory level of 19.00 percent was reported in the households, 18.84 percent in commercial warehouses and 31.77 percent in NFA depositories (Table 1).
- As of January 2018, about 57.89 percent of the total rice stocks inventory came from the households, 37.44 percent from commercial warehouses, and 4.67 percent from NFA depositories. The latter comprised 91.71 percent of the imported rice.
- The total rice inventory for this month would last for 67 days.
CORN
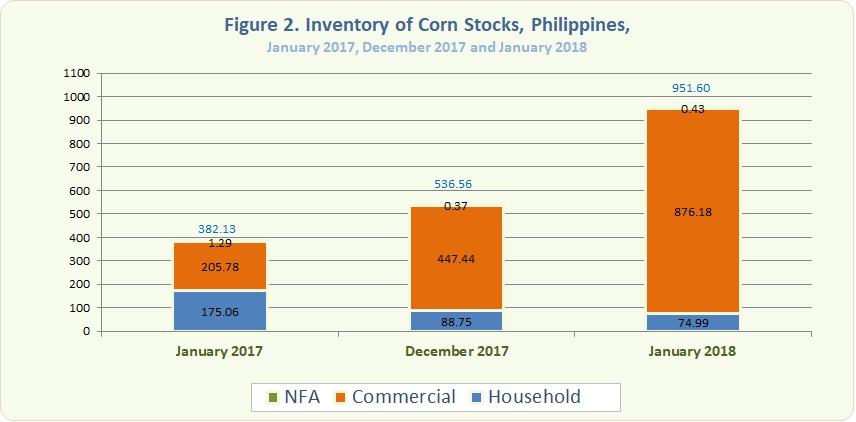
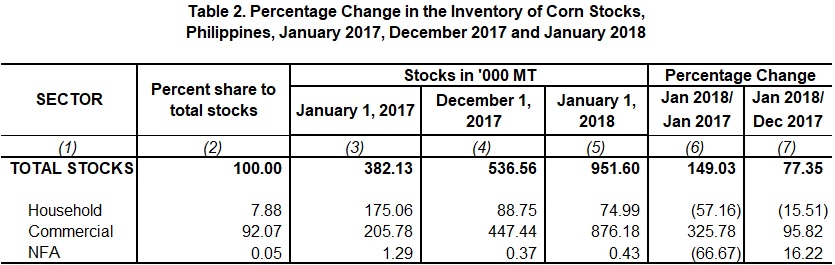
- As of 01 January 2018, the total corn stocks inventory was 951.60 thousand metric tons (Figure 2). It was 149.03 percent higher than the previous year's inventory level of 382.13 thousand metric tons. Likewise, it was 77.35 percent higher than the previous month’s inventory level of 536.56 thousand metric tons (Table 2).
- Year-on-year, an increase of 325.78 percent in corn stocks inventory level was reported in commercial warehouses. On the contrary, both stocks in households and NFA depositories dropped by 57.16 percent and 66.67 percent, respectively (Table 2).
- With reference to the previous month, corn stocks inventory level in households declined by 15.51 percent while both inventory levels in commercial warehouses and NFA depositories increased by 95.82 percent and 16.22 percent, respectively (Table 2).
- Of this month’s total corn stocks inventory level, 7.88 percent were from the households, 92.07 percent from commercial warehouses and 0.05 percent were from NFA depositories.
ROMEO S. RECIDE
Assistant Secretary
Deputy National Statistician
Sectoral Statistics Office
Technical Notes
Monthly rice and corn stocks inventory are generated from three sectors, namely: household, commercial, and National Food Authority (NFA). The household stocks are taken from the Palay and Corn Stocks Survey (PCSS1) of the PSA, which covers farming and non-farming households nationwide. The commercial stocks are sourced from registered grains businessmen through the Commercial Stocks Survey (CSS), conducted by the NFA, the results of which are submitted to PSA. NFA stocks are monitored from their warehouses/depositories.