
Rice and Corn Stocks Inventory, June 2024
RICE
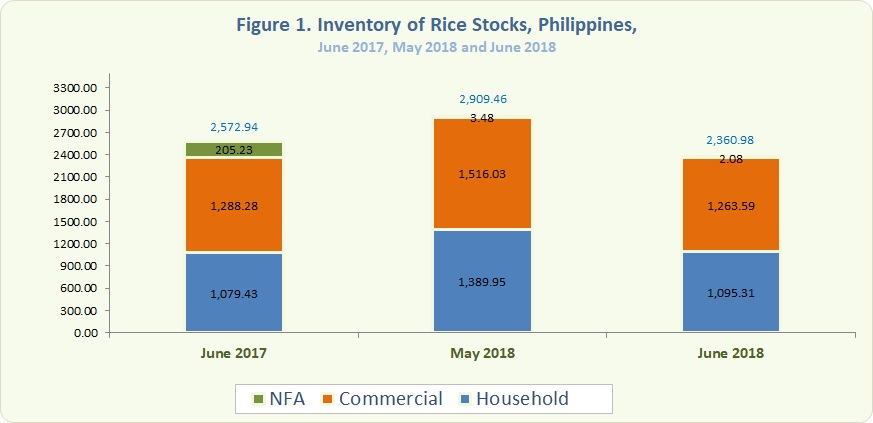
- As of 01 June 2018, the total rice stock inventory was estimated at 2,360.98 thousand metric tons (Figure 1). This was a drop of 8.24 percent from previous year's level of 2,572.94 thousand metric tons and 18.85 percent below the previous month's stocks level of 2,909.46 thousand metric tons (Table 1).
- Compared to last year's inventory level, households' stocks displayed an increment of 1.47 percent. However, both stocks in commercial warehouses and NFA depositories declined by 1.92 percen and 98.99 percent, respectively (Table 1).
- Of this month's inventory level stocks in all sectors were lower than the last month's level. Stocks in households, commercial warehouses and NFA depositories showed decrements of 21.20 percent, 16.65 percent and 40.29 percent, respectively (Table 1 ).
- As of this month's total rice stocks inventory, 46.39 percent were from the households, 53.52 percent from commercial warehouses, and 0.09 percent from NFA depositories. imported rice.
CORN
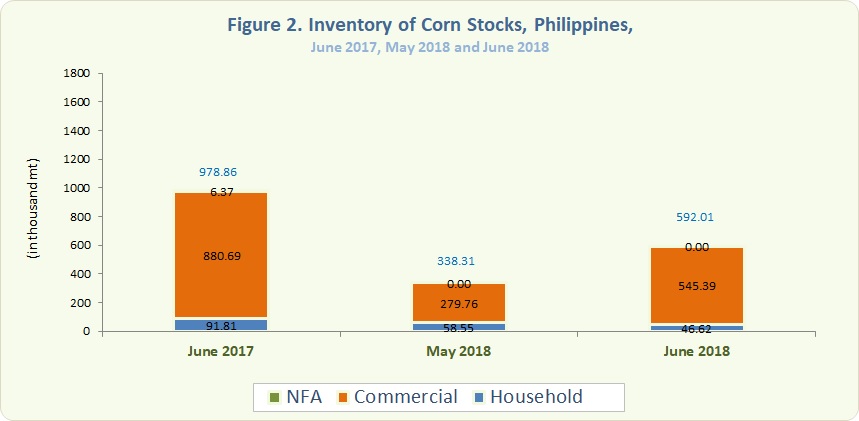
- The total corn stocks inventory level as of 01 June 2018 was 592.01 thousand metric tons (Figure 2). This increased by 74.99 percent as compared to the previous month's level of 338.31 thousand metric tons. On the other hand, a decrease of 39.50 percent was noted over last year's level of 978.87 thousand metric tons (Table 2).
- With reference to the previous year's inventory level, corn stocks in the households, commercial warehouses, and NFA depositories declined by 49.22 percent, 38.07 percent, and 100.00 percent, respectively (Table 2).
- Month on month, stocks level in the households contracted by s20.38 percent while an increase was observed in commercial warehouses by 94.95 percent (Table 2).
- About 7.87 percent of this month's total corn stocks inventory were with the households and 92.13 percent were with the commercial warehouses.
ROSALlNDA P. BAUTISTA
(Director II)
Officer-in-Charge
Sectoral Statistics Office
Technical Notes
Monthly rice and corn stocks inventory are generated from three sectors, namely: household, commercial, and National Food Authority (NFA). The household stocks are taken from the Palay and Corn Stocks Survey (PCSS) of the PSA, which covers farming and non-farming households nationwide. The commercial stocks are sourced from registered grains businessmen through the Commercial Stocks Survey (CSS), conducted by the NFA, the results of which are submitted to PSA. NFA stocks are monitored from their warehouses/depositories.