
Rice and Corn Stocks Inventory, June 2024
RICE
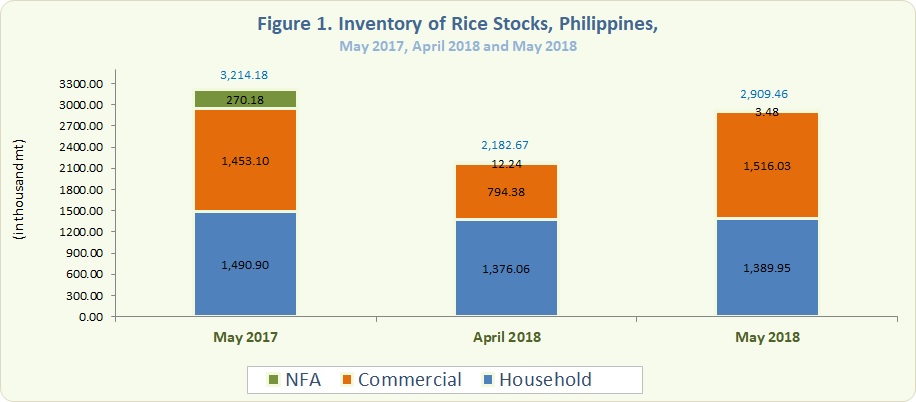
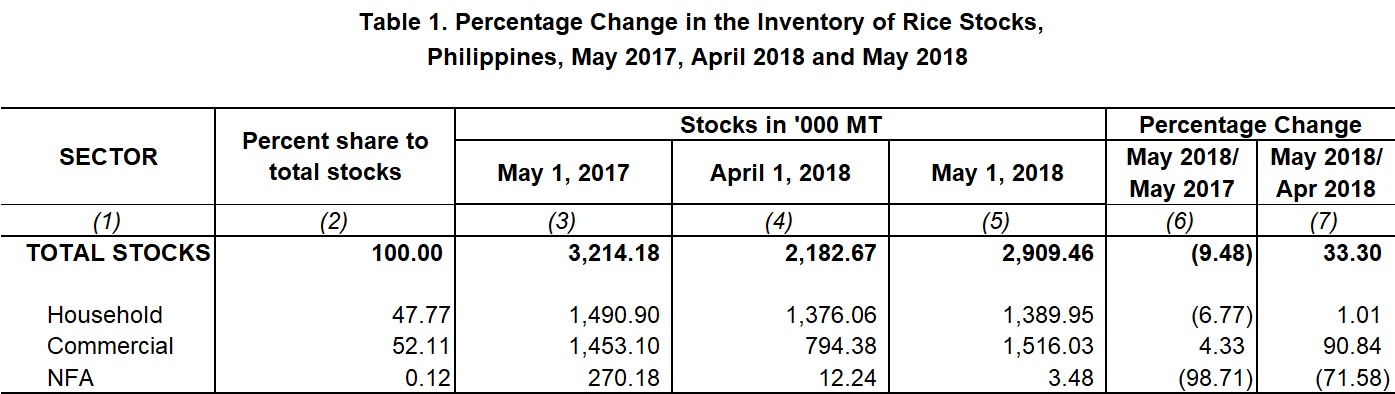
- The total rice stocks inventory level as of 01 May 2018 was at 2,909.46 thousand metric tons (Figure 1). This was 9.48 percent below the previous year's volume of stock at 3,214.18 thousand metric tons and 33.30 percent above last month's inventory level of 2,182.67 thousand metric tons (Table 1).
- Rice stocks in commercial warehouses increased by 4.33 percent with reference to last year's inventory level. However, both stocks held in the households and NFA depositories decreased by 6.77 percent and 98.71 percent, respectively (Table1).
- This month's stocks level for both households and commercial warehouses went up by 1.01 percent and 90.84 percent, respectively, compared to the previous month's record. On the contrary, rice stocks inventory level in NFA depositories dropped by 71.58 percent (Table 1).
- About 47.77 percent of the current inventory level were with the households, 52.11 percent with commercial warehouses, and 0.12 percent with NFA depositories. The latter comprised 62.67 percent of the imported rice.
 .
.
CORN
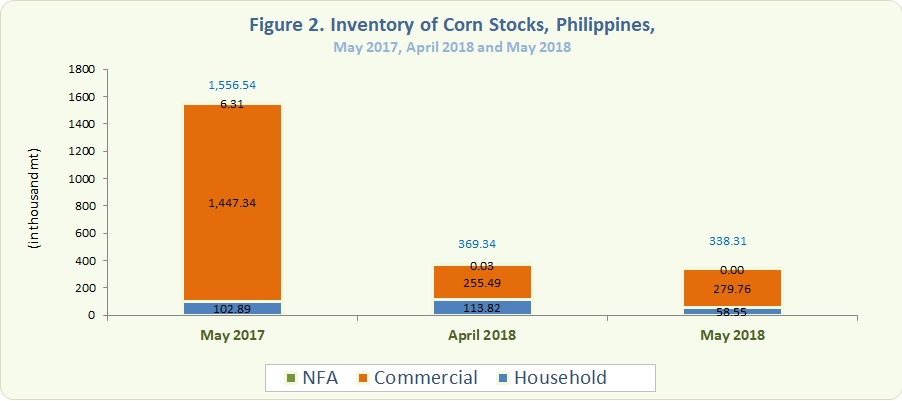
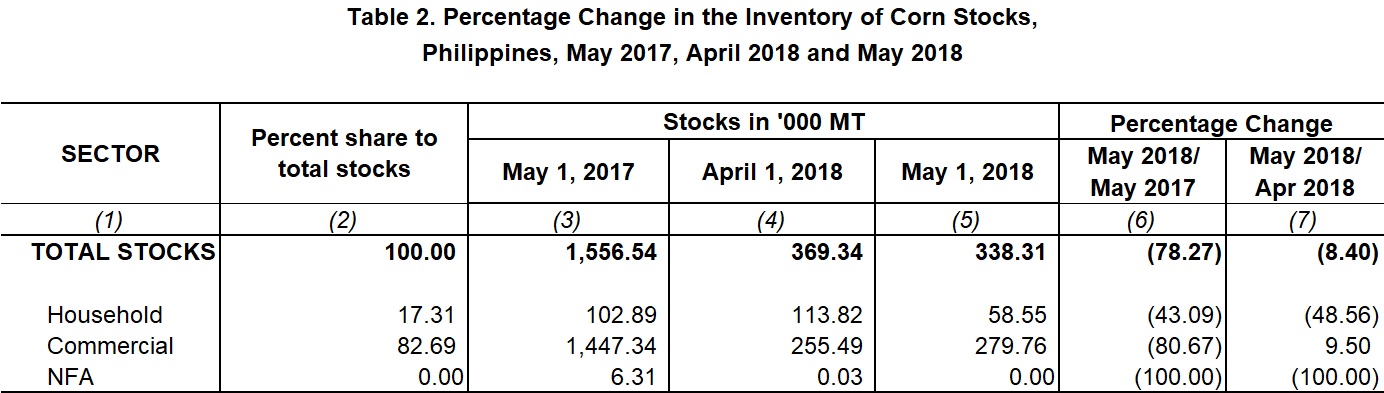
- As of 01 May 2018, the total corn stocks inventory level was estimated at 338.31 thousand metric tons (Figure 2). In comparison with last year's level of 1,556.54 thousand metric tons and previous month's level of 369.34 thousand metric tons, both records showed a drop of 78.27 percent and 8.40 percent, respectively (Table 2).
- All sectors' level of stocks dropped in comparison to last year’s record. About 43.09 percent decrease was observed in the households, 80.67 percent in commercial warehouses, and 100.00 percent in NFA depositories (Table 2).
- Over last month, stocks level in commercial warehouses was greater by 9.50 percent. However, both volume of stocks in households and NFA depositories was below this month's level by 48.56 percent and 100.00 percent, respectively (Table 2).
- The households contributed around 17.31 percent of this month’s total corn stocks inventory level and 82.69 percent were from commercial warehouses.
ROMEO S. RECIDE
Assistant Secretary
Deputy National Statistician
Sectoral Statistics Office
Technical Notes
Monthly rice and corn stocks inventory are generated from three sectors, namely: household, commercial, and National Food Authority (NFA). The household stocks are taken from the Palay and Corn Stocks Survey (PCSS) of the PSA, which covers farming and non-farming households nationwide. The commercial stocks are sourced from registered grains businessmen through the Commercial Stocks Survey (CSS), conducted by the NFA, the results of which are submitted to PSA. NFA stocks are monitored from their warehouses/depositories.