
Rice and Corn Stocks Inventory, June 2024
RICE
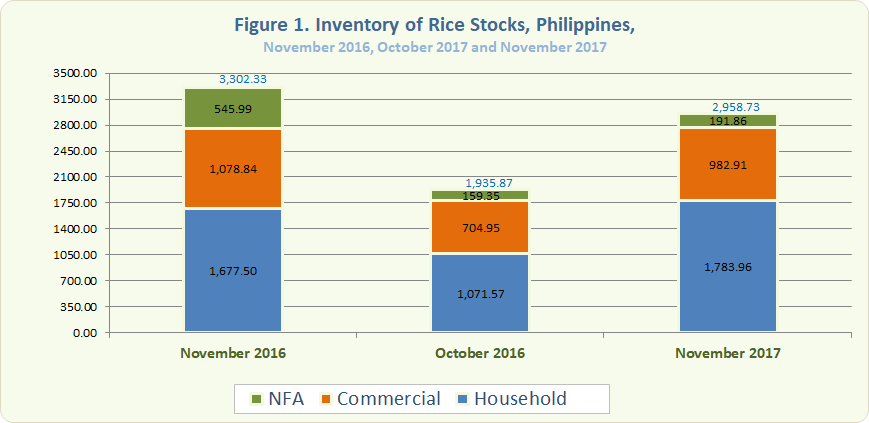
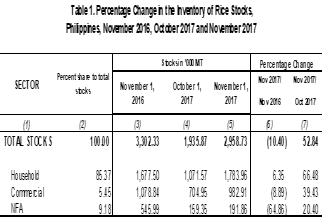
- The total rice stocks inventory as of 01 November 2017 was 2,958.73 thousand metric tons as shown in Figure 1. It was 10.40 percent lower compared to the November 2016 inventory level of 3,302.33 thousand metric tons and 52.84 percent greater than the previous month inventory level of 1,935.87 thousand metric tons (Table 1).
- With reference to the previous year, a rise of 6.35 percent was seen in the households' stocks inventory level. However, both stocks inventory level in commercial warehouses and NFA depositories decreased by 8.89 percent and 64.86 percent, respectively (Table 1).
- Month-to-month, increases of 66.48 percent, 39.43 percent and 20.40 percent were observed in households' stocks inventory, commercial warehouses and in NFA depositories, respectively (Table 1).
- About 60.29 percent of this month’s total rice stock inventory were with the households, 33.22 percent came from commercial warehouses and 6.48 percent in NFA depositories. The latter comprised 94.86 percent of the imported rice.
- The total rice inventory for 01 November 2017 would be sufficient for 87 days. Stocks would be enough for 52 days in the households, 29 days in commercial warehouses, and 6 days in NFA depositories.
CORN
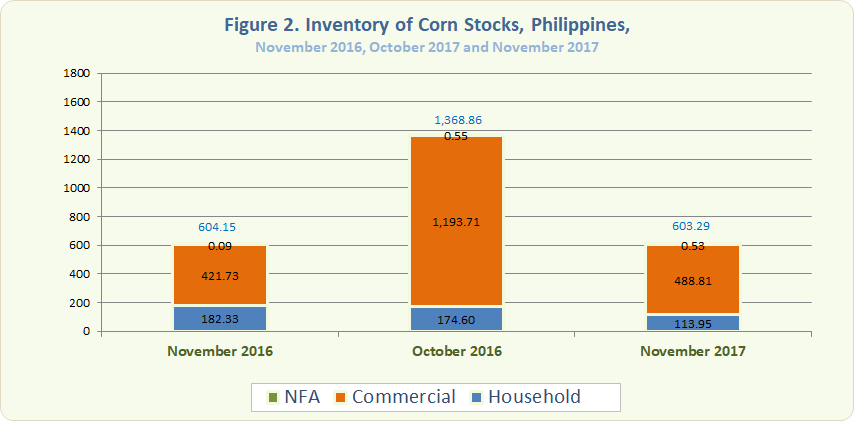
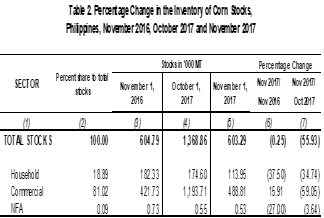
- The total corn stocks inventory as of 01 November 2017 was 603.29 thousand metric tons as shown in Figure 2. It was 0.25 percent lower compared to the November 2016 inventory level of 604.79 thousand metric tons and 55.93 percent below than the previous month inventory level of 1,368.86 thousand metric tons (Table 2).
- Year-to-year, a rise of 15.91 percent was observed in commercial warehouses. However, both in households' and NFA depositories' stocks inventory level dropped by 37.50 percent and 27 percent, respectively (Table 2).
- With reference to the previous month, corn stocks declined by 34.75 percent in households, 59.05 percent in commercial warehouses, and 3.64 percent in NFA depositories (Table 2).
- Around 18.89 percent of this month's total corn stock inventory were contributed by the households, 81.02 percent were from commercial warehouses and 0.09 percent were from NFA depositories.
ROMEO S. RECIDE
Assistant Secretary
Deputy National Statistician
Sectoral Statistics Office
Technical Notes
Monthly rice and corn stocks inventory are generated from three sectors, namely: household, commercial, and National Food Authority (NFA). The household stocks are taken from the Palay and Corn Stocks Survey (PCSS1) of the PSA, which covers farming and non-farming households nationwide. The commercial stocks are sourced from registered grains businessmen through the Commercial Stocks Survey (CSS), conducted by the NFA, the results of which are submitted to PSA. NFA stocks are monitored from their warehouses/depositories.