
Rice and Corn Stocks Inventory, June 2024
RICE
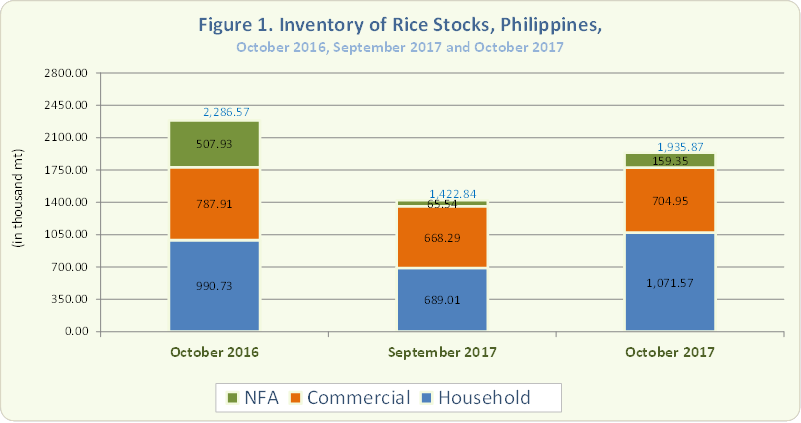
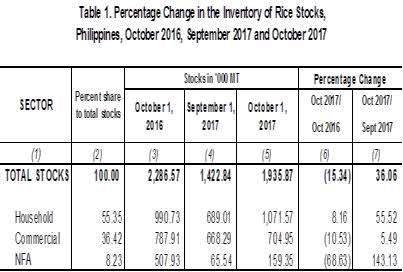
- The total rice stocks inventory as of October 1, 2017 was 1,935.87 thousand metric tons (Figure 1). It was 15.34 percent lower as compared to October 2016 inventory level of 2,286.57 thousand metric tons and 36.06 percent higher than the 1,422.84 thousand metric tons inventory level of the previous month (Table 1).
- Compared to the previous year, an increase of 8.16 percent was recorded in the households' stocks inventory level. However, rice stocks in commercial warehouses and NFA depositories dropped by 10.53 and 68.63 percent, respectively.
- Rice stocks in the households, in commercial warehouses and in NFA depositories grew by 55.52 percent, 5.49 percent and 143.13 percent, respectively, as compared with the previous month (Table 1).
- Of this month's total rice stock inventory, 55.35 percent came from the households and 36.42 percent were from commercial warehouses. The NFA depositories contributed 8.23 percent of the total rice stock inventory comprising a 0.94 percent of imported rice.
- The total rice inventory for this month would last for 57 days. Stocks would be enough for 32 days in the households, 21 days in commercial warehouses, and 5 days in NFA depositories.
CORN
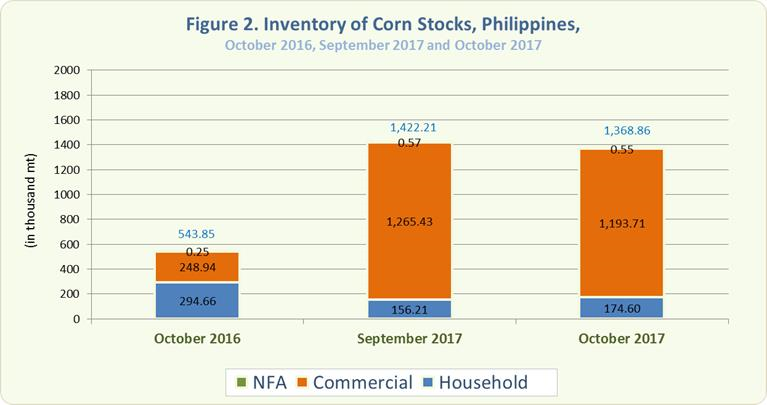
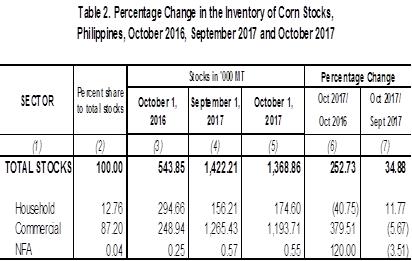
- The total corn stocks inventory as of October 1, 2017 was 1,368.86 thousand metric tons (Figure 2). It grew by 151.70 percent as compared to October 2016 inventory level of 543.85 thousand metric tons and 3.75 percent lower than the 1,422.21 thousand metric tons inventory level of the previous month (Table 2).
- Compared to the previous year, a decrease of 40.75 percent was seen on stock inventory in the households while there was an increase of 379.51 percent in commercial warehouses and 120.00 percent in NFA depositories (Table 2).
- On a month-to-month growth, corn stocks in the households grew by 11.77 while both in the commercial warehouses and NFA depositories dropped by 5.67 percent and 3.51 percent, respectively (Table 2).
- Of this month's total corn stocks inventory, 12.76 percent came from the households, 87.20 percent from commercial warehouses, and the remaining 0.04 percent accounted for those from NFA depositories.
ROMEO S. RECIDE
Assistant Secretary
Deputy National Statistician
Sectoral Statistics Office
Technical Notes
Monthly rice and corn stocks inventory are generated from three sectors, namely: household, commercial, and National Food Authority (NFA). The household stocks are taken from the Palay and Corn Stocks Survey (PCSS1) of the PSA, which covers farming and non-farming households nationwide. The commercial stocks are sourced from registered grains businessmen through the Commercial Stocks Survey (CSS), conducted by the NFA, the results of which are submitted to PSA. NFA stocks are monitored from their warehouses/depositories.