
Rice and Corn Stocks Inventory, June 2024
RICE
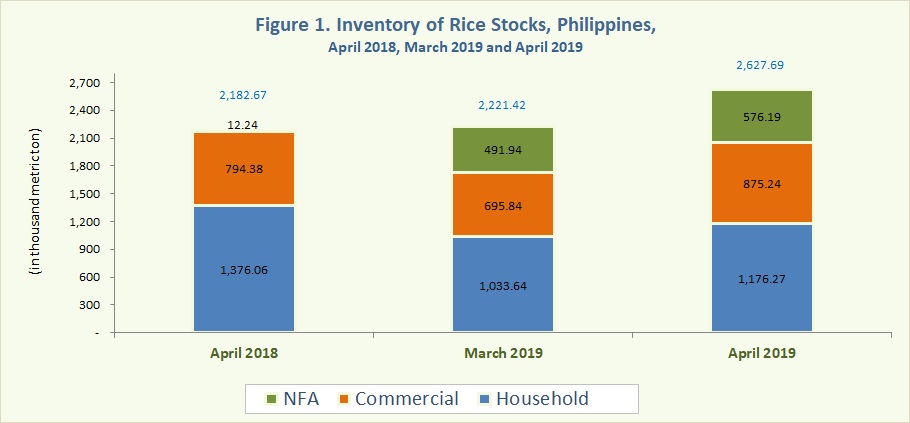
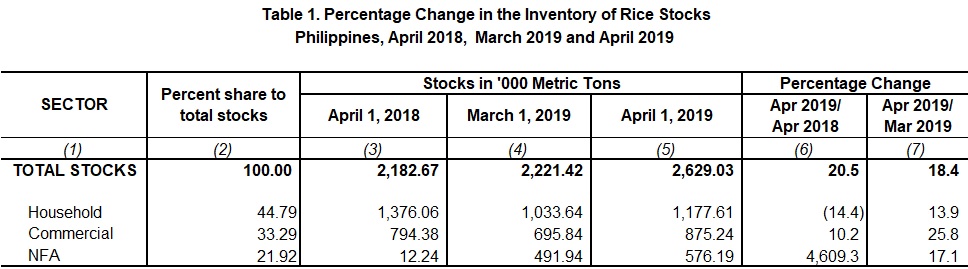
- As of 01 April 2019, the total rice stocks inventory was estimated at 2,629.03 thousand metric tons. The level of stocks was 20.5 percent above the previous year’s record of 2,182.67 thousand metric tons and 18.4 percent higher than previous month’s level of 2,221.42 thousand metric tons (Figure 1).
- Relative to previous year’s inventory level, households stocks displayed a decrease of 14.4 percent. Nevertheless, both stocks in commercial warehouses and NFA depositories noted a substantial increase of 10.2 percent and 4,609.3 percent, respectively (Table 1).
- With reference to the previous month, the existing stocks in all sectors were higher than the last month’s level. Stocks in the households, commercial warehouses and NFA depositories showed increments of 13.9 percent, 25.8 percent and 17.1 percent, respecticely (Table 1).
- Of this month’s total rice stock inventory, around 44.8 percent were in the households, 33.3 percent were in commercial warehouses, and 21.9 percent in NFA depositories.
CORN
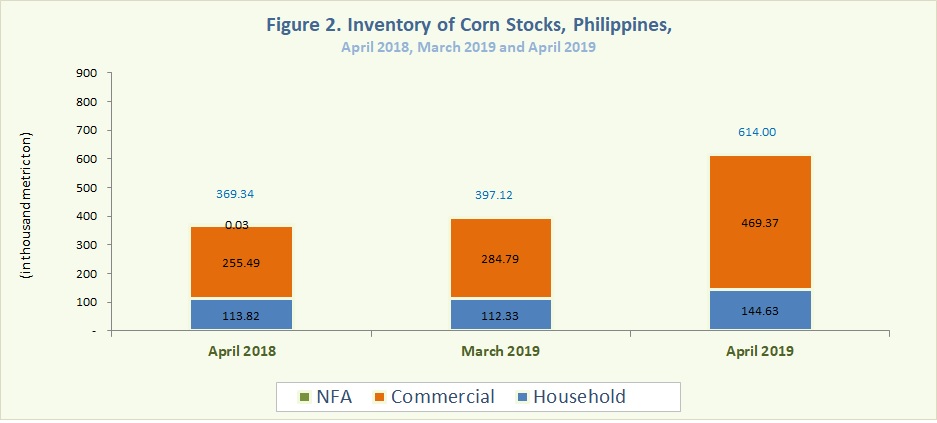
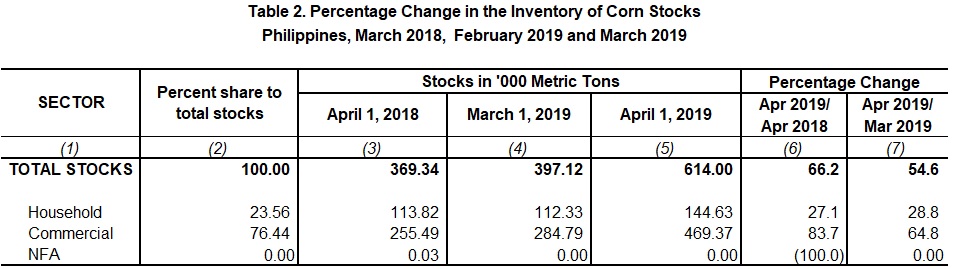
- The total corn stocks inventory as of 01 April 2019 was 614.00 thousand metric tons. This was 66.2 percent higher as compared to the previous year’s level of 369.34 thousand metric tons. Likewise, corn stocks inventory for the period was up by 54.6 percent from the previous month’s stock level (Figure 2).
- Year-on-year, corn stocks inventory level rose by 27.1 percent in the households and 83.7 percent in commercial warehouses. There were no corn stocks in NFA depositories for this month (Table 2).
- Relative to the previous month’s level, corn stocks in the households and commercial warehouses increased by 28.8 percent and 64.8 percent, respectively.
- More than three fourths (76.4%) of this months’ total corn stocks inventory were in commercial warehouses and the remaining 23.6 percent were in the households.
ROSALlNDA P. BAUTISTA
(Director II)
Officer-in-Charge
Sectoral Statistics Office
Technical Notes
Monthly rice and corn stocks inventory are generated from three sectors, namely: household, commercial, and National Food Authority (NFA). The household stocks are taken from the results of Palay and Corn Stocks Survey (PCSS) of the PSA, which covers farming and non-farming households nationwide. The commercial stocks are sourced from registered grains businessmen through the Commercial Stocks Survey (CSS). The CSS is conducted by the NFA, the results of which are submitted to PSA. NFA stocks are monitored from their warehouses/depositories.