
Rice and Corn Stocks Inventory, June 2024
RICE
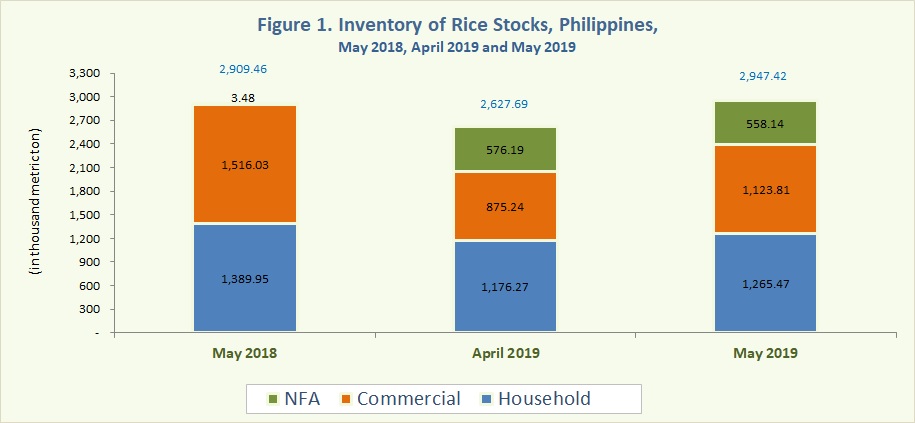
- The country's total rice stocks inventory as of 01 May 2019 was estimated at 2,947.42 thousand metric tons. It showed an increase of 1.3 percent from the previous year's record of 2,909.46 thousand metric tons. Rice stock inventory for the period was up by 12.2 percent from the previous month's stocks level of 2,627.69 thousand metric tons (Figure 1).
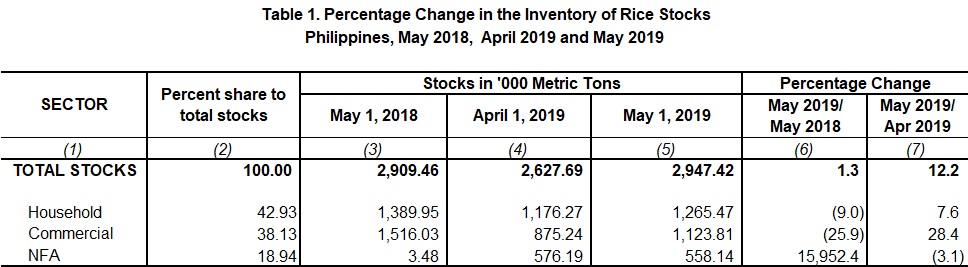
- In comparison to the previous year’s rice stocks inventory level, stocks in households and commercial warehouses displayed a decrease of 9.0 percent and 25.9 percent, respectively. A surge of 15,952.4 percent was noted in NFA depositories (Table 1).
- Month-on-month, rice stocks inventory level in households and commercial warehouses grew by 7.6 percent and 28.4 percent, respectively. However, stocks in NFA depositories declined by 3.1 percent (Table 1).
- About 42.9 percent of this month’s total rice stocks inventory were in the households, 38.1 percent were in commercial warehouses, and 18.9 percent were in NFA depositories.
CORN
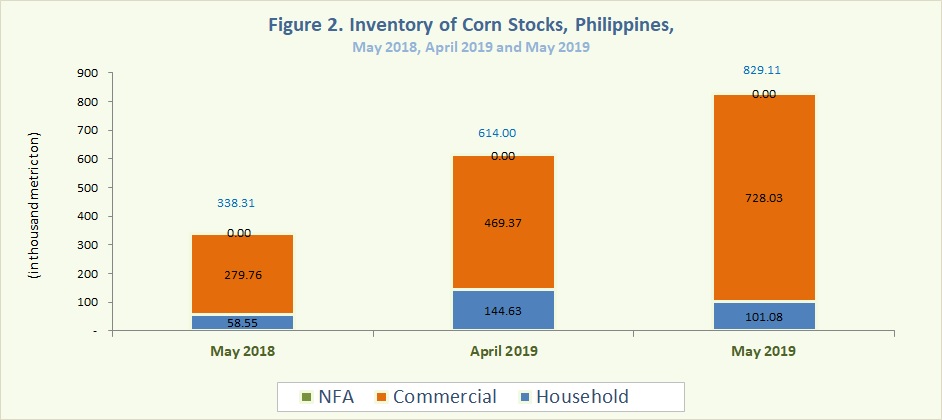
- As of 01 May 2019, the total corn stocks inventory stood at 829.11 thousand metric tons. In comparison with the previous year's level of 338.31 thousand metric tons, this indicated an increment of 145.1 percent. Also, this showed an increase of 35.0 percent relative to previous month's stocks inventory level of 614.00 thousand metric tons (Figure 2).
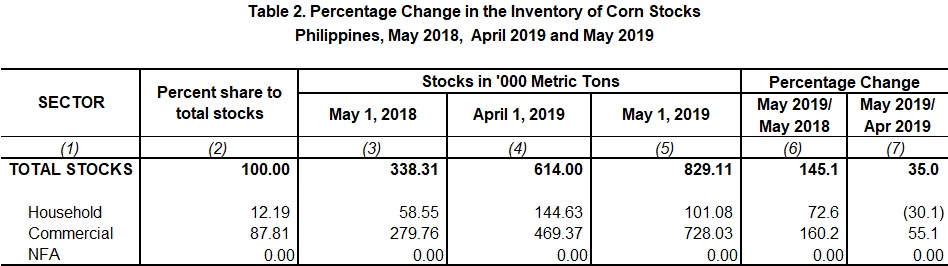
- This month’s stocks inventory level in the households and commercial warehouses went up by 72.6 percent and 160.2 percent from previous year’s record, respectively. There were no corn stocks in NFA depositories for this month (Table2).
- As of 01 May 2019, stocks inventory level in households was lower by 30.1 percent from previous month’s level. Nevertheless, a 55.1 percent increment was recorded in commercial warehouses (Table 2).
- The current stocks inventory level were comprised of 12.2 percent from the households and 87.8 percent from commercial warehouses.
ROSALlNDA P. BAUTISTA
(Director II)
Officer-in-Charge
Sectoral Statistics Office
Technical Notes
Monthly rice and corn stocks inventory are generated from three sectors, namely: household, commercial, and National Food Authority (NFA). The household stocks are taken from the results of Palay and Corn Stocks Survey (PCSS) of the PSA, which covers farming and non-farming households nationwide. The commercial stocks are sourced from registered grains businessmen through the Commercial Stocks Survey (CSS). The CSS is conducted by the NFA, the results of which are submitted to PSA. NFA stocks are monitored from their warehouses/depositories.