
Rice and Corn Stocks Inventory, June 2024
RICE
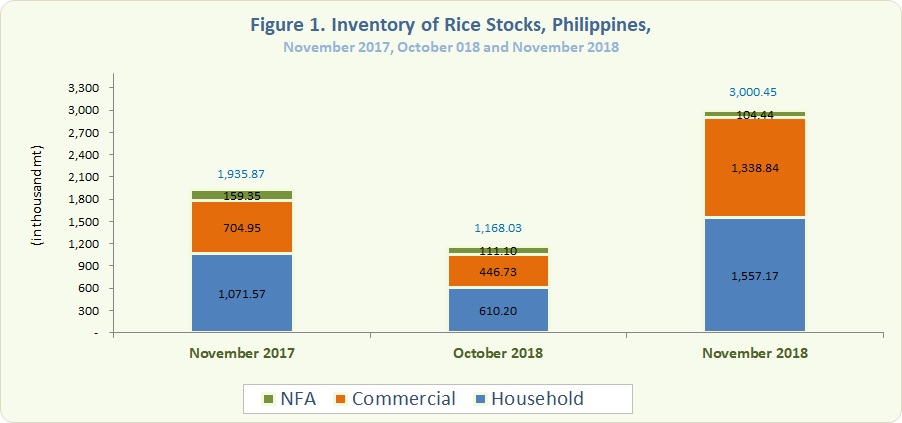
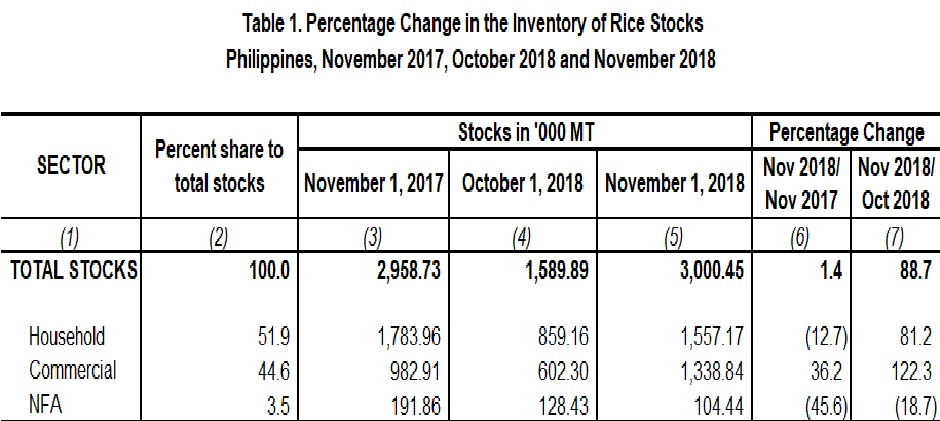
- The total rice stocks inventory as of 01 November 2018 was 3,000.45 thousand metric tons (Figure 1). This was 88.7 percent higher than previous month’s inventory of 1,589.89 thousand metric tons and 1.4 percent above the 2,958.73 thousand metric tons recorded in November 2017 (Table 1).
- Compared with the previous year, rice stocks in the households and in NFA depositories declined by 12.7 percent and 45.6 percent, respectively. However, stocks in commercial warehouses were up by 36.2 percent (Table 1).
- Month-on-month, stocks in the households and in commercial warehouses increased by 81.2 percent and 122.3 percent, respectively. On the other hand, stocks in NFA depositories were reduced by 18.7 percent (Table 1).
- Of this month’s total rice stock inventory, more than half (51.9%) were in the households, 44.6 percent were in commercial warehouses and 3.5 percent were in NFA depositories. The latter comprised 92.1 percent imported rice.
CORN
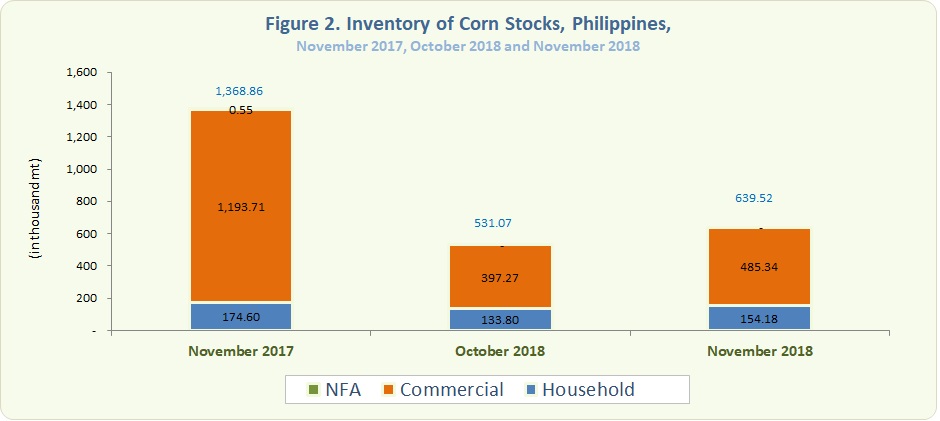
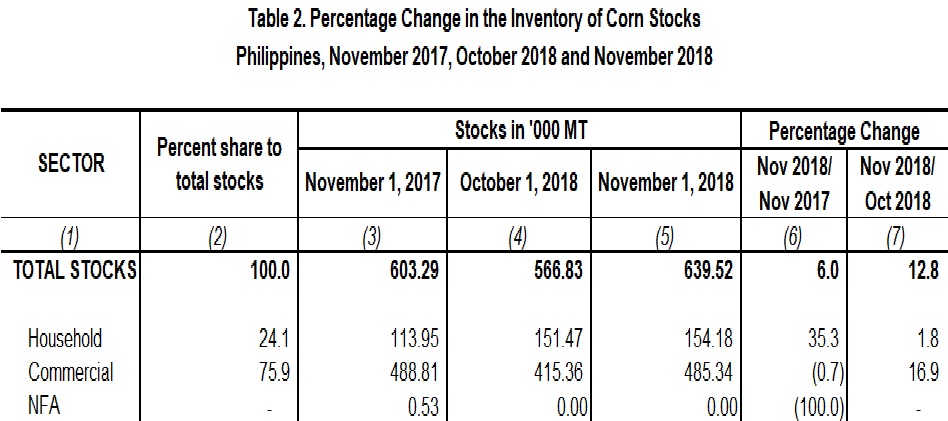
- As of 01 November 2018, the total corn stocks inventory mounted at 639.52 thousand metric tons (Figure 2), an increase of 12.8 percent from previous month’s level of 566.83 thousand metric tons. Likewise, corn stocks inventory was up by 6.0 percent from the previous year’s level (Table 2).
- Relative with their levels in the previous year, corn stocks inventory in the households registered an increase of 35.3 percent. However, stocks in the commercial warehouses decreased by 0.7 percent. As of 01 November 2018, there were no stocks in NFA depositories (Table 2).
- This month’s total corn stocks inventory level for households and commercial stocks increased by 1.8 percent and 16.9 percent, respectively.
- Around 75.9 percent of this month’s total corn stock inventory were in commercial warehouses while 24.1 percent were with the households.
ROSALlNDA P. BAUTISTA
(Director II)
Officer-in-Charge
Sectoral Statistics Office
Technical Notes
Monthly rice and corn stocks inventory are generated from three sectors, namely: household, commercial, and National Food Authority (NFA). The household stocks are taken from the results of Palay and Corn Stocks Survey (PCSS) conducted by the Philippine Statistics Authority (PSA), which covers farming and non-farming households nationwide. The commercial stocks are sourced from registered grains businessmen through the Commercial Stocks Survey (CSS). The CSS is conducted by the NFA, the results of which are submitted to PSA. NFA stocks are monitored from their warehouses/depositories.