
Rice and Corn Stocks Inventory, June 2024
RICE
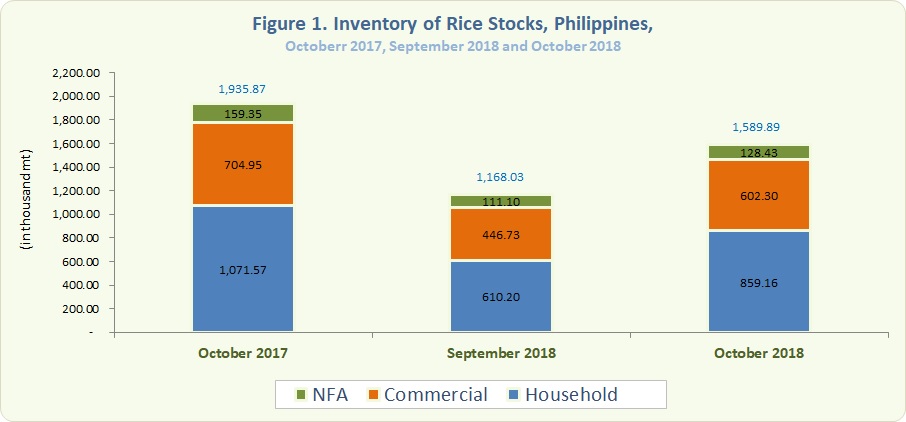
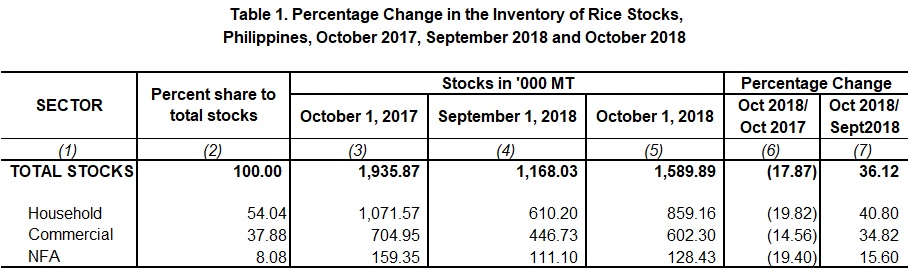
- As of 01 October 2018, the total rice stocks inventory was 1,589.89 thousand metric tons (Figure 1). It was 17.87 percent lesser as compared to October 2017 inventory level of 1,935.87 thousand metric tons and 36.12 percent higher than the 1,168.03 thousand metric tons inventory level of the previous month (Table 1).
- With reference to the previous year, rice stocks in households, commercial warehouses and NFA depositories dropped by 19.82 percent, 14.56 percent and 19.40 percent, respectively (Table 1).
- Compared with the previous month, stocks in the households, in commercial warehouses and in NFA depositories grew by 40.80 percent, 34.82 percent and 15.60 percent, respectively.
- As of October 2018, more than half (54.04%) of the total stocks inventory were in the households, 37.88 percent were in commercial warehouses and 8.08 percent were in NFA depositories. The latter comprised about 99.83 percent of the imported rice.
CORN
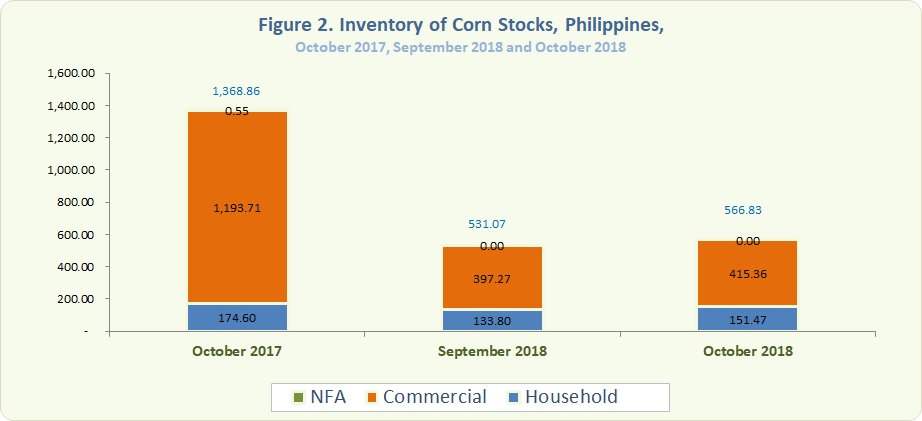
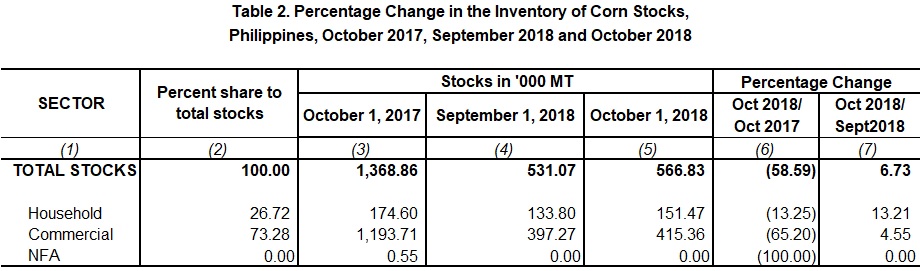
- The country’s total corn stocks inventory level as of 01 October 2018 stood at 566.83 thousand metric tons (Figure 2). It showed a decrease of 58.59 percent lower from the last year's record of 1,368.86 thousand metric tons. Nevertheless, corn stocks inventory for the period was up by 6.73 percent from the previous month’s stock level (Table 2).
- Corn stocks inventory from all sectors decreased compared to their levels in the previous year. Respective drops of 13.25 percent and 65.20 percent were observed in the households and commercial warehouses stocks. For this month, there were no corn stocks in NFA depositories (Table 2).
- This month’s corn stocks inventory level for both households and commercial stocks went up by 13.21 percent and 4.55 percent, respectively. There were no stocks in NFA depositories in the previous month.
- The households contributed about 26.72 percent of this month’s total corn stocks inventory while 73.28 percent were from commercial warehouses.
ROSALlNDA P. BAUTISTA
(Director II)
Officer-in-Charge
Sectoral Statistics Office
Technical Notes
Monthly rice and corn stocks inventory are generated from three sectors, namely: household, commercial, and National Food Authority (NFA). The household stocks are taken from the Palay and Corn Stocks Survey (PCSS) of the PSA, which covers farming and non-farming households nationwide. The commercial stocks are sourced from registered grains businessmen through the Commercial Stocks Survey (CSS). The CSS is conducted by the NFA, the results of which are submitted to PSA. NFA stocks are monitored from their warehouses/depositories.