
Rice and Corn Stocks Inventory, June 2024
RICE STOCK
The country’s total rice stocks inventory as of 01 November 2021 was registered at 2,418.43 thousand metric tons. This implies a contraction of -23.4 percent from 3,158.54 thousand metric tons in the same period of the previous year.
In contrast, rice stocks inventory of this month rose by 23.7 percent over the October 2021 stocks inventory of 1,954.72 thousand metric tons. (Figure 1 and Table 1)
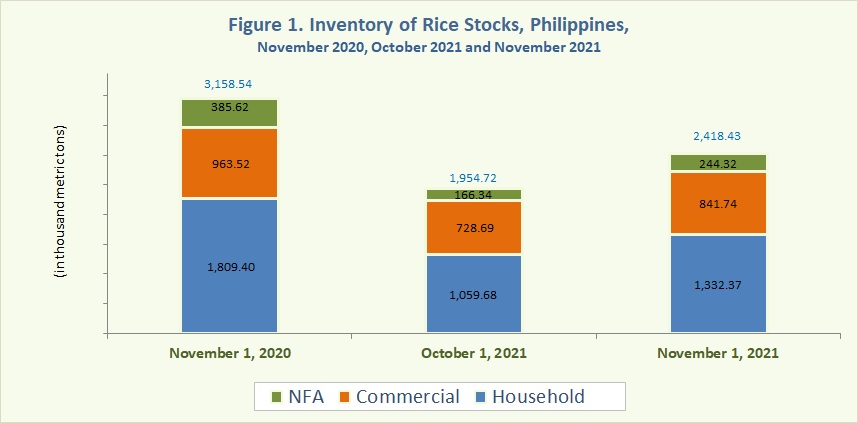
The stocks inventory level in all sectors decreased compared with the inventory levels from the same period of 2020. A -26.4 percent decline in households, -12.6 percent in commercial warehouses/wholesalers/retailers, and -36.6 percent in NFA depositories were observed.
On the contrary, rice stocks inventory level grew by 25.7 percent in the households, 15.5 percent in the commercial warehouses/wholesalers/retailers, and 46.9 percent in the NFA depositories over their respective levels in October 2021.
Of the November 2021 total rice stocks inventory, 55.1 percent were from the households, 34.8 percent were from the commercial warehouses/wholesalers/retailers, and 10.1 percent were from the NFA depositories. (Table 1)
Table 1. Level and Percent Change of Rice Stocks by Sector: Philippines
November 2020, October 2021, and November 2021

CORN STOCK
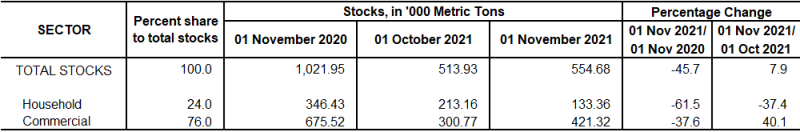
As of 01 November 2021, corn stocks inventory was at 554.68 thousand metric tons. The inventory level in November 2021 was -45.7 percent lower than the recorded inventory level of 1,021.95 thousand metric tons of the same period of the preceding year.
On the other hand, an increase of 7.9 percent was observed in the corn stocks inventory over the previous month’s level of 513.93 thousand metric tons. (Table 2 and Figure 2)
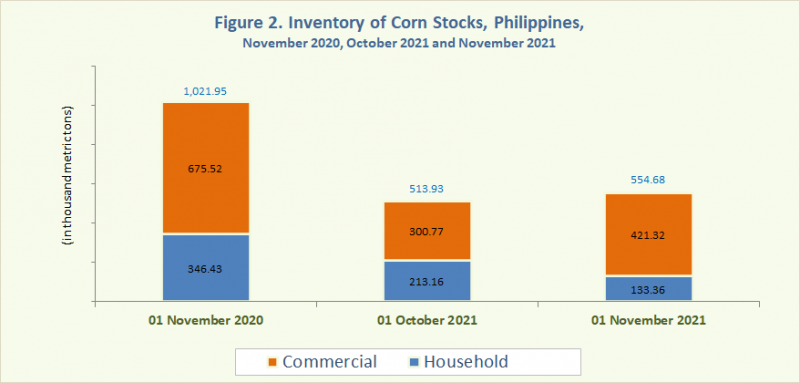
Compared to the November 2020 levels, reductions in corn stocks inventory were noted in both households and commercial warehouses/wholesalers/retailers at -61.5 percent and -37.6 percent, respectively.
The households’ corn stocks inventory level declined by -37.4 percent as compared to the preceding month. However, stocks in commercial warehouses/wholesalers/retailers’ inventory rose by 40.1 percent from the previous month.
About 76.0 percent of this month’s total corn stocks were from commercial warehouses/wholesalers/retailers, and 24.0 percent were from households. (Table 2)
Table 2. Level and Percent Change of Corn Stocks by Sector: Philippines
November 2020, October 2021, and November 2021
DENNIS S. MAPA, Ph.D.
Undersecretary
National Statistician and Civil Registrar General
Technical Notes
Monthly rice and corn stocks inventory are generated from three sectors, namely: household, commercial, and government (National Food Authority). The household stocks are taken from the results of Palay and Corn Stocks Survey (PCSS) of the Philippine Statistics Authority (PSA).
Effective February 2021, PSA also generates the commercial stocks inventory from the results of Commercial Stocks Survey (CSS) per Implementing Rules and Regulations of Republic Act (RA) No. 11203 known as the “Rice Tariffication Law”. The government stocks inventory is taken from administrative records from the National Food Authority.
The PCSS covers sample farming households and non-farming households nationwide. Sample farming households are sub-sample of Palay Production Survey (PPS) and Corn Production Survey (CPS). In these surveys, the primary sampling units (PSUs) are the palay/corn producing barangays and secondary sampling units (SSUs) are the palay/corn farming households. The PSUs are selected using probability proportional to size while the SSUs are selected through systematic sampling. For the non-farming households, five non-farming households are selected for each barangay.
The CSS employs a two-stage systematic sampling wherein the first level of stratification is the line of activity of the NFA registered grains businessmen and the second level of stratification is the businessmen’s capitalization. The line of activity of grains businessmen are stratified into four: 1 - retailers, 2 - wholesalers, 3 - combined retailers/wholesalers and 4 - warehousemen. The line of activity is further sub-stratified according to businessmen’ capitalization such as 1 - big, 2 - medium and 3 - small capitalization structure, while warehousemen are sub-stratified into two, that is 1 - big and 2 - combined medium and small.