Highlights of the Philippine Export and Import Statistics May 2024 (Preliminary)
YEAR 2000 EXPORT REVENUE GROWS BY 8.7 PERCENT
Total receipts from merchandise export for the period January to December 2000 grew by 8.7 percent to $38.077 billion from $35.037 billion in 1999.
For the month of December, total receipts increased by 18.8 percent to $3.495 billion compared to $2.944 billion in 1999.
Fig. 1. Philippine Export by Month: 2000
( F.O.B. Value in Million US Dollar )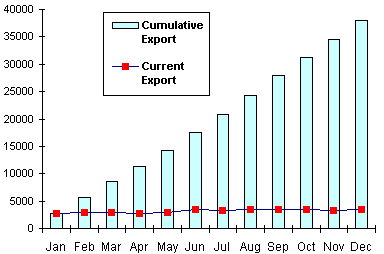
ELECTRONICS COMPONENTS INCREASE BY 15.6 PERCENT
Electronics Components, accounting for 59.2 percent of the aggregate receipt, led the top earners for the month of December 2000. Value of shipments worth $2.070 billion increased by 15.6 percent from $1.790 billion in 1999.
Articles of Apparel and Clothing Accessories ranked second with a 7.5 percent share and reported sales of $262.64 million which was 19.3 percent higher than $220.23 million a year ago.
The third top earner consisted of Woodcrafts and Furniture with sales of $74.62 million which was a 56.3 percent increase from $47.73 million last year.
Earnings from Coconut Oil worth $63.81 million went up by 108.4 percent from $30.62 million a year ago.
Ignition Wiring Set and Other Wiring Sets Used in Vehicles, the fifth biggest earner, reported sales amounting to $50.54 million, which was an increase of 22.2 percent over $41.34 million in 1999.
Receipts from Petroleum Products grew by 339.6 percent to $36.76 million from $8.36 million in 1999.
Completing the list of the top exports for December 2000 were Other Products Manufactured from Materials Imported on Consignment Basis, $35.00 million; Cathodes & Sections of Cathodes, Of Refined Copper, $28.92 million Metal Components, $27.01 million; and Bananas (Fresh), $26.26 million.
Combined revenue from the top ten exports for December amounted to $2.676 billion, or 76.6 percent of the total.
Fig. 2. Philippine Top Exports in December: 1999 & 2000
( F.O.B. Value in Million US Dollar )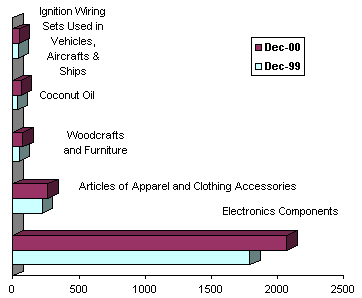
REVENUES FROM MANUFACTURED GOODS ROSE BY 18.4 PERCENT
Manufactured Goods comprised almost 90.0 percent of total exports. Receipts from this major export group reached $3.144 billion which was up by 18.4 percent over $2.656 billion a year earlier.
Combined sales from Agro-Based Products and Other Agro-Based Products, netted $172.05 million. Compared to last year, aggregate revenue increased by 40.1 percent from $122.82 million.
Exports of Petroleum Products rose by 339.6 percent to $36.76 million while Mineral Products declined by 21.1 percent to $68.85 million.
Special Transactions amounting to $71.46 million increased by 9.0 percent from $65.58 million last year.
Fig. 3. Philippine Exports by Commodity Group in December: 1999 & 2000
( F.O.B. Value in Thousand US Dollar )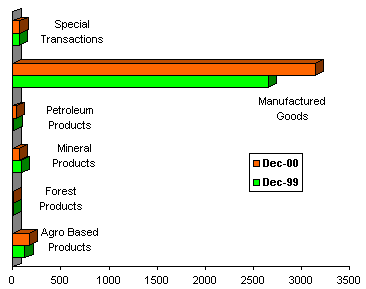
US CORNERS 34.2 PERCENT OF DECEMBER EXPORT REVENUE
Accounting for 34.2 percent of the total exports, purchases from United States worth $1.195 billion grew by 44.5 percent from $826.98 million a year earlier.
Japan remained at the second spot with a 15.8 percent share. Sales to Japan rose by 34.4 percent to $550.72 million from $409.62 million a year ago.
Singapore bought goods valued at $300.83 million or 8.6 percent of the total exports. Compared to last year, sales to Singapore grew by 30.6 percent from $230.35 million.
Other major markets for December 2000 were Netherlands, $283.45 million; Taiwan, $215.70 million; Hongkong, $130.88 million; Republic of Korea, $105.50 million, United Kingdom of Great Britain, $105.37 million; Germany, $101.60 million; and, Malaysia $77.76 million.
Total earnings from the top ten markets amounted to $3.067 billion or 87.7 percent of the total.
Fig. 4. Philippine Top Exports by Country in December: 2000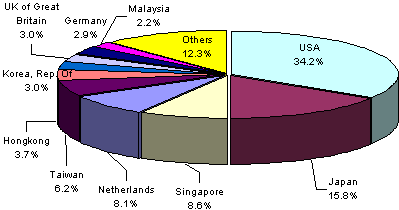
Source: National Statistics Office
Manila, Philippines