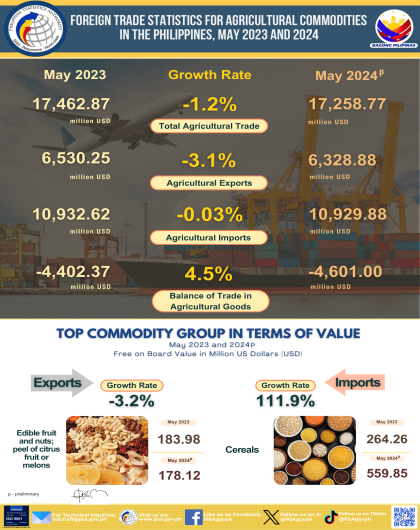
Highlights of the Philippine Export and Import Statistics May 2024 (Preliminary)
JANUARY - OCTOBER EXPORTS REACHED $ 31.265 BILLION
Total receipts from merchandise export for the period January to October 2000 grew by 7.7 percent to $31.265 billion from $29.018 billion last year.
For the month of October, total receipts went down by 1.8 percent to $3.398 billion compared to $3.460 billion in 1999.
Fig. 1. Philippine Export by Month: 2000
( F.O.B. Value in Million US Dollar )
ELECTRONICS COMPONENTS DOWN BY 11.9 PERCENT
Electronics Components, accounting for 60.2 percent of the aggregate receipt, led the top earners for the month of October 2000. Value of shipments worth $2.046 billion decreased by 11.9 percent from $2.322 billion in 1999.
Articles of Apparel and Clothing Accessories, ranked second with a 5.7 percent share and reported sales of $193.67 million which was 24.7 percent higher than $155.31 million a year ago.
The third top earner consisted of Ignition Wiring Sets and Other Wiring Sets Used in Vehicles with sales of $55.57 million which was a 4.9 percent increase from $52.97 million last year.
Earnings from Petroleum Products worth $49.21 million, increased by 52.3 percent from $32.31 million a year ago.
Coconut Oil, the fifth biggest earner reported sales amounting to $42.01 million, a decrease of 22.5 percent over $54.22 million in 1999.
Receipts from Woodcraft and Furniture dropped by 13.4 percent to $41.48 million from $47.88 million in 1999.
Completing the list of the top exports for October 2000 were: Other Products Manufactured from Materials Imported on Consignment basis, $31.45 million; Metal Components, $30.98 million; Bananas (Fresh), $30.20 million; and, Shrimps and Prawns, Fresh, Chilled or Frozen, $18.45 million.
Combined revenue from the top ten exports for October amounted to $2.539 billion, or 74.7 percent of the total.
Fig. 2. Philippine Top Exports in October: 1999 & 2000
( F.O.B. Value in Million US Dollar )
REVENUES FROM MANUFACTURED GOODS DOWN BY 3.1 PERCENT
Manufactured Goods comprised 90.1 percent of total exports. Receipts from this major export group reached $3.063 billion down by 3.1 percent over $3.160 billion a year earlier.
Combined sales from Agro-Based Products and Other Agro-Based Products, ranked second among the major export groups netted $152.88 million. Compared to last year, aggregate revenue dropped by 1.4 percent from $155.01 million.
Exports of Mineral Products declined by 31.5 percent to $38.53 million while Petroleum Products rose by 52.3 percent to $49.2 million.
Special Transactions amounting to $88.11 million increased by 62.3 percent from $54.30 million last year.
Fig. 3. Philippine Exports by Commodity Group in October: 1999 & 2000
( F.O.B. Value in Thousand US Dollar )
US CORNERS 29.4 PERCENT OF OCTOBER EXPORT REVENUE
Accounting for 29.4 percent of the total exports, purchases from United States worth $999.50 million grew by 16.7 percent from $856.25 million a year earlier.
Japan remained at the second spot with a 15.6 percent share. Sales to Japan rose by 19.7 percent to $529.00 million from a year ago value of $442.11 million.
Singapore, bought goods valued at $306.06 million or 9.0 percent of the total exports. Compared to last year, sales to Singapore grew by 46.7 percent from $208.59 million.
Other major markets for October 2000 were Netherlands, $294.73 million; Taiwan, $228.85 million; Hongkong, $141.46 million; Malaysia, $135.31 million, Germany, $123.96 million; Thailand, $116.13 million; and, United Kingdom of Great Britain, $114.77 million.
Total earnings from the top ten markets amounted to $2.990 billion or 88.0 percent of the total.
Fig. 4. Philippine Top Exports by Country in October: 2000
( F.O.B. Value in Million US Dollar )
Source: National Statistics Office
Manila, Philippines