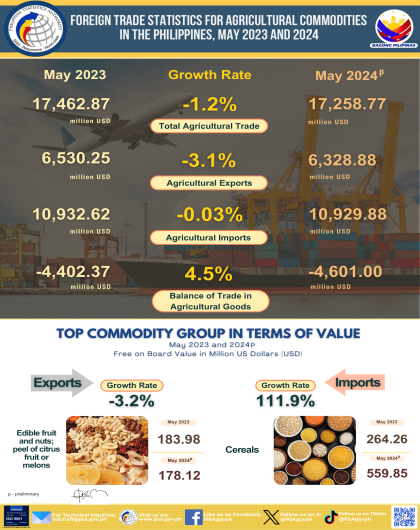
Highlights of the Philippine Export and Import Statistics May 2024 (Preliminary)
Merchandise exports registered 4.2 percent increase
Registered earnings for June 2003 went up by 4.2 percent to $3.060 billion from $2.936 billion during the same month last year.
Receipts from merchandise exports for January to June 2003 increased by 2.1 percent to $17.068 billion from $16.712 billion during the same period a year earlier.
Electronic products declined by 5.2 percent
Electronic products, accounting for 63.1 percent of the aggregate export revenue for the month, dropped by 5.2 percent to $1.930 billion from $2.036 billion last year. Among the major groups of electronic products, components/devices (semiconductors) dominate the groupings with 45.4 percent share to total exports. It decreased by 5.6 percent to $1.391 billion from $1.473 billion during the same period of 2002.
Articles of apparel and clothing accessories remained as the countrys second top earner with a combined share of 7.8 percent and an aggregate receipt of $237.66 million or 9.6 percent higher than $216.80 million a year ago.
Petroleum products, ranked third with total revenue of $59.61 million reflecting a 241.2 percent increase from $17.47 million a year earlier.
Other products manufactured from materials imported on consignments basis ranked fourth with sales amounting to $47.20 million or a year-on-year increase of 25.9 percent from $37.48 million.
Revenue from ignition wiring set and other wiring sets used in vehicles, aircrafts and ships grew by 15.5 percent to $41.78 million from $36.17 million during the same month of 2002.
Rounding-up the list of the top exports for the month of June 2003 were:woodcrafts and furniture, $41.06 million; coconut oil, $34.22 million;bananas (fresh), $30.97 million; metal components, $20.07 million; and tuna, $19.04 million.
Aggregate receipt for the top ten exports amounted to $2.462 billion, or 80.5 percent of the total exports.
Fig. 1. Philippine Top Exports: June: 2002 and 2003
(F.O.B. Value in Million US Dollars)
Manufactured goods inched-up by 0.8 percent
Accounting for 87.1 percent of the total receipts, exports ofmanufactured goods rose by 0.8 percent as sales reached $2.666 billion, from $2.646 billion during the same month a year ago.
Income from all agro-based products, combined for $146.87 million or 4.8 percent of the total export revenue. Compared to last year, aggregate receipt for this commodity group grew by 17.6 percent from $124.85 million.
Special transactions increased by 25.9 percent to $132.43 million from $105.15 million, while receipt from exports of mineral products went up by 29.3 percent to $51.81 million from $40.08 million.
Petroleum products contributed $59.61 million, while forest productsadded $2.70 million dollars.
Fig. 2. Philippine Exports by Commodity Group: June: 2002 and 2003
(F.O.B. Value in Million US Dollars)
Exports to U.S. account for 23.1 percent
Accounting for 23.1 percent of the countrys aggregate receipts for the month, exports to the United States valued at $706.12 million, declined by 6.1 percent from last year's reported figure of $751.97 million.
Japan followed with a 15.2 percent share. Valued at $465.53 million, exports to Japan grew by 3.6 percent from $449.55 million.
Hong Kong accounted for 8.8 percent of the total receipts, with $269.47 million reflecting a 59.2 percent increase from $169.28 million during the same month of 2002.
Netherlands emerged as the fourth biggest market for the month as shipments of local goods amounted to $210.04 million or 6.9 percent of the total. Compared to the same period last year, receipts increased by 45.8 percent from $144.08 million. Other top markets for June 2003 were:Malaysia, $202.29 million; Singapore, $184.08 million; Taiwan, $169.23million; Peoples Republic of China, $169.00 million; Thailand,$109.67 million; and Germany, $108.61 million.
Total export receipts from RPs top ten markets for the month of June amounted to $2.594 billion or 84.8 percent of the total.
Fig. 3. Philippine Top Exports by Country: June 2003
(F.O.B. Value in Million US Dollars)
Source: Economic Indices and Indicators Division
Industry and Trade Statistics Department
National Statistics Office
Manila, Philippines