Non-Bank Financial Intermediation establishments dominate Financial Intermediation Sector
-
The 2003 Annual Survey of Philippine Business and Industry covered a total of 15,871 Financial Intermediation establishments. Of the total figure, 15,228 establishments or 95.9 percent had an average total employment (ATE) of less than 20. The remaining 643 establishments or 4.1 percent had an average total employment of 20 or more.
-
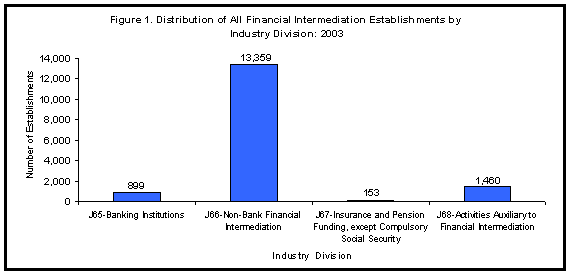
By industry division, Non-Bank Financial Intermediation (PSIC J66) registered the highest number (13,359) of establishments. This accounted for 84.2 percent of the total financial intermediation establishments. Activities Auxiliary to Financial Intermediation (PSIC J68) followed next with 1,460 establishments (9.2%) while Banking Institutions (PSIC J65) ranked third with 899 establishments (5.7%). On the other hand, establishments engaged in Insurance and Pension Funding except Compulsory Social Security (PSIC J67) recorded the least number of establishments with 153 or 1.0 percent of the total. Figure 1 shows the distribution of establishments by industry division.

Non-Bank Financial Intermediation the top employers in the sector
-
Financial Intermediation establishments generated jobs for an estimated 230,503 workers. Of the total work force, 223,950 (97.2%) were paid employees and 6,553 (2.8%) were working owners and unpaid workers.
-
More than half (56.1%) of Financial Intermediation workers (129,399) were employed in large establishments with average total employment (ATE) of 20 or more. The remaining 101,104 employees (43.9%) were employed in small establishments with average total employment (ATE) of less than 20. (See Tables B & C for summary statistics for large and small establishments).
-
Non-Bank Financial Intermediation (PSIC J66) and Banking Institutions (PSIC J65) were the top employers in the sector which employed 98,701 workers (42.8%) and 96,718 workers (42.0%), respectively. Insurance and Pension Funding, except Compulsory Social Security (PSIC J67) recorded the least number of workers with 15,279 persons (6.6%). Figure 2 shows the distribution of employment by industry division.

Employees in the Banking sector received highest pay
-
Total compensation paid to employees by financial intermediation establishments amounted to Php62.79 billion in 2003 or equivalent to an average annual remuneration of Php280,374.
-
Industry wise, Banking Institutions (PSIC J65) reported the largest share (62.1%) in compensation with an estimated amount of Php38.99 billion. This was followed by Non-Bank Financial Intermediation (PSIC J66) with Php13.35 billion (21.3%). On the other hand, Activities Auxiliary to Financial Intermediation (PSIC J68) posted the least share in compensation with Php5.00 billion (8.0%).
-
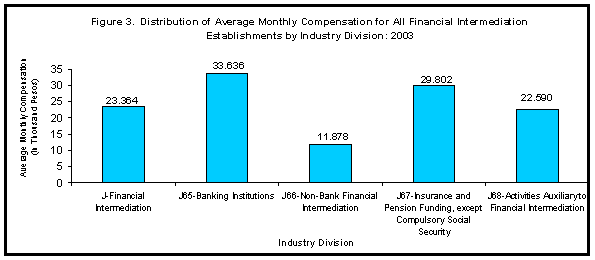
Highest earners were employees in Banking Institutions (PSIC J65) with an average monthly pay of Php33,636. This was closely followed by workers in Insurance and Pension Funding, except Compulsory Social Security (PSIC J67) with Php29,802 monthly pay. Meanwhile, workers in Non-Bank Financial Intermediation (PSIC J66) establishments received the lowest average monthly pay of Php11,878. Figure 3 shows the distribution of average monthly compensation by industry division.

More than half of the sector's total revenue is contributed by the Banking Institutions
-
In 2003, the total revenue generated by the sector reached Php519.78 billion.
-
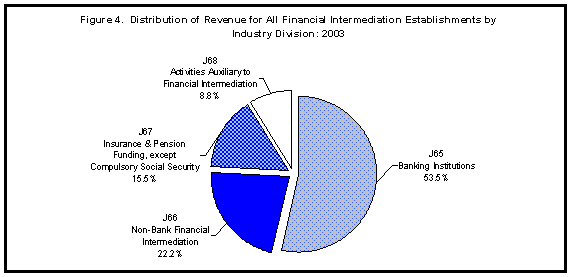
Among the industry divisions, Banking Institutions (PSIC J65) earned the highest with Php277.88 billion, accounting for more than half (53.5%) of the total revenue. Non-Bank Financial Intermediation (PSIC J66) placed second which generated Php115.44 billion (22.2%) while Insurance and Pension Funding, except Compulsory Social Security (PSIC J67) ranked third with Php80.80 billion (15.5%). In contrast, Activities Auxiliary to Financial Intermediation (PSIC J68) received the least income amounting to Php45.65 billion (8.8%). Figure 4 shows the distribution of revenue by industry division.

Operational cost in Financial Intermediation sector totals to Php334.37 billion
-
In 2003, the operational costs spent by Financial Intermediation establishments was estimated at Php334.37 billion.
-
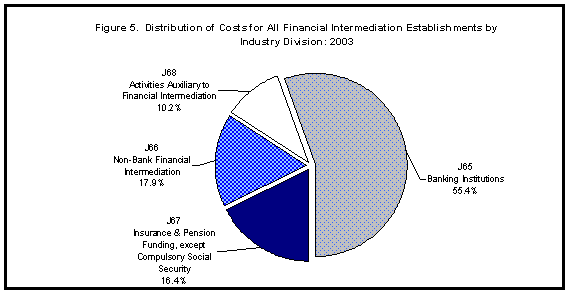
The biggest spender in the sector was Banking Institutions (PSIC J65) which incurred Php185.30 billion or more than half (55.4%) of the sector's total costs. This was followed by Non-Bank Financial Intermediation (PSIC J66) and Insurance and Pension Funding, except Compulsory Social Security (PSIC J67) with Php59.96 billion (17.9%) and Php54.85 billion (16.4%), respectively. Whereas, Activities Auxiliary to Financial Intermediation (PSIC J68) spent the least with Php34.26 billion (10.2%). Figure 5 shows the distribution of costs by industry division.

Revenue per peso cost is valued at Php1.55
-
The ratio of revenue per peso cost by Financial Intermediation establishments was estimated at 1.55. This means that for every peso spent by the industry, a corresponding revenue of Php1.55 was generated.
-
Non-Bank Financial Intermediation (PSIC J66) is the only industry in the sector that surpassed the national average revenue per peso cost, at Php1.93. This was followed by Banking Institutions (PSIC J65) and Insurance and Pension Funding, except Compulsory Social Security (PSIC J67) with a ratio of Php1.50 and Php1.47, respectively. (See Table R1. Selected Ratios for All Financial Intermediation Establishments).
Total gross additions to fixed assets amounted to Php18.33 billion
-
Total gross additions to fixed assets acquired by financial intermediation establishments were assessed at Php18.33 billion in 2003.
-
Banking Institutions (PSIC J65) added the largest to fixed assets amounting to Php8.75 billion or 47.7 percent of the total. This was followed by Non-Bank Financial Intermediation (PSIC J66) with an addition to fixed assets worth Php6.54 billion (35.7%). On the other hand, Activities Auxiliary to Financial Intermediation (J68) had the least additions to fixed assets amounting to Php1.49 billion (8.1%).
Value Added generated by the sector reaches Php240.97 billion
-
The total value added generated by Financial Intermediation establishments was estimated at Php240.97 billion.
-
Banking Institutions (PSIC J65) registered the highest value added with Php124.40 billion or more than half (51.6%) of the total. Non-Bank Financial Intermediation (PSIC J66) followed next with Php63.07 billion (26.2%) while establishments engaged in Insurance and Pension Funding, except Compulsory Social Security (PSIC J67) contributed Php33.82 billion (14.0%). Activities Auxiliary to Financial Intermediation (PSIC J68) had the least share to total value added worth Php19.67 billion (8.2%).
Subsidies provided by government amounted to Php750.22 million
-
The total subsidies granted by government to support the operation of financial intermediation establishments reached Php750.22 million in 2003.
-
Activities Auxiliary to Financial Intermediation (J68) received the highest financial aid from the government amounting to Php315.01 million or 42 percent of the total subsidies. This was followed by Banking Institutions (PSIC J65) and Non-Bank Financial Intermediation (PSIC J66) with reported subsidies of Php231.38 million (30.8%) and Php196.05 million (26.1%), respectively. Insurance and Pension Funding, except Compulsory Social Security (PSIC J67) received the least subsidies with Php7.78 million.
Technical Notes
Scope and Coverage
The 2003 Annual Survey of Philippine Business and Industry (ASPBI) formerly known as Annual Survey of Establishments (ASE) was conducted to collect information on the structure and trends of economic activities in the entire country for the year 2003. Covered were establishments engaged in economic activities as defined under the 1994 Philippine Standard Industrial Classification (PSIC).
These establishments were classified into 14 sectors, one of which was on Financial Intermediation (Sector J). The sector is composed of establishments engaged in four industry divisions, namely: banking institution (J65); non-bank financial intermediation (J66); insurance and pension funding, except compulsory social security (J67) and activities auxiliary to financial intermediation (J68).
All financial intermediation establishments nationwide with average total employment (ATE) of 20 or more were covered on a 100 percent basis and those with ATE less than 20 were selected using simple random sampling. For this survey year, the branches of Banking Institutions (PSIC J65) were excluded as samples instead they were included in the report of their main offices.
Response
A total of 823 or 89.65% responded out of the 918 samples drawn for the sector. Adjustments for non-response were made through imputations.
Concepts and Definition of terms
Establishment is an economic unit, which engages under a single ownership or control, i.e. under a single legal entity, in one, or predominantly one kind of economic activity at a single fixed location.
Economic activity or business is the activity of the establishment as classified under the1994 Philippine Standard Industrial Classification (PSIC). The main activity refers to the activity that contributes the biggest or major portion of the gross income or revenue of the establishment.
Total Employment is the number of persons who worked in or for the establishment as of November 15, 2003.
Paid employees are all persons working in the establishments receiving pay as well as those working away from the establishment when paid by and under the control of the establishment. Included are persons working as full-time or part-time and those employees on sick leave or maternity leave, paid vacation or holiday. Excluded are consultants, home workers and workers receiving commission only.
Unpaid workers include working owners who do not receive regular pay, apprentices and learners without regular pay, and persons working without regular pay for at least one third of the working time normal to the establishment.
Salaries and wages are payments in cash or in kind, prior to deduction for employee's contribution to SSS/GSIS, withholding tax, etc. Included are total basic pay, vacation, sick, maternity leave pay, overtime pay, and other benefits.
Revenue refers to cash received and receivables for goods sold and services rendered.
Cost refers to all expenses excluding compensation incurred during the year whether paid or payable. Valuation should be at market price including taxes and other charges, net of discounts, rebates, returns and allowances. Goods received from and services rendered by other establishment of the same enterprise are valued as though purchased
Gross additions to fixed assets refer to the cost of acquisition of fixed assets acquired in 2003 less the value of sales of fixed assets during the year.
Fixed assets are physical assets expected to have productive life of more than one year and intended for use and/or being used by the establishment. Included are land, buildings, fixtures, machinery, tool, furniture, office equipment, vehicles, and the like.
Capital expenditures refer to the cost of acquisition of fixed assets acquired in 2003 whether or not full payments have been made.
Subsidies are special grants in the form of financial assistance or tax exemption or tax privilege given by the government to develop an industry or production and to protect it against competition.
Inventories refer to stocks of goods owned by or under the control of the establishment as of a fixed date, regardless of where the stocks are located. Valuation should be at current replacement cost in purchaser's price at the indicated dates. Replacement cost is the cost of an item in terms of its present price rather than its original price.
Change in Inventories as a derived indicator is computed as the value of ending inventory less the value of beginning inventory.
Value added is equal to the sum of total revenue and cost of fixed assets produced on own account less the following items - cost of materials and supplies purchased; cost of goods purchased for resale; cost of real estate purchased for sale; cost of fuels purchased to run vehicles, machinery and other equipment; cost of electricity purchased; cost of industrial services done by others; cost of non-industrial services done by others; cost of computer software expenses; cost of research and experimental development; and other costs (except indirect taxes for banking institutions and financial intermediaries; and indirect taxes and interest expense for insurance); this result being corrected for change in inventories.
Source: National Statistics Office
Manila, Philippines
