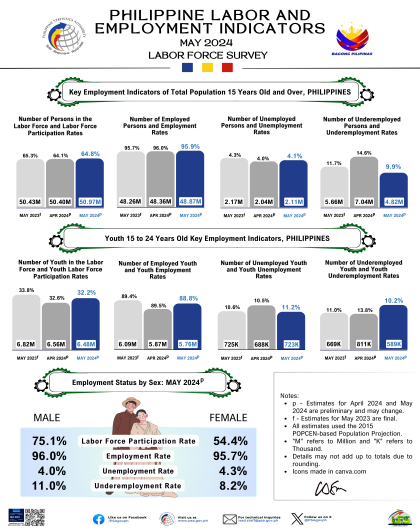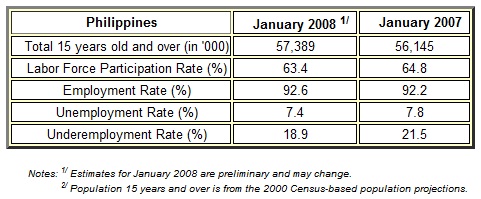
The number of employed persons in January 2008 was registered at 33.7 million. This placed the employment rate at 92.6 percent. Last year's rate was 92.2 percent.
Across regions, the Autonomous Region in Muslim Mindanao (ARMM) had the highest employment rate (97.6%), followed by Cagayan Valley (96.5%) and Cordillera Administrative Region (96.0%). The National Capital Region recorded the lowest employment rate at 87.5 percent.
The number of persons in the labor force in January 2008 was estimated at 36.4 million out of the estimated 57.4 million population 15 years and over. These numbers translate into a labor force participation rate of 63.4 percent, compared to last year's figure of 64.8 percent.
Of the estimated 33.7 million employed persons, around one-half (50.2%) were in the services sector, more than one-third (35.0%) in the agriculture sector and the rest (14.8%) were in the industry sector. These proportions were almost the same as in January 2007 estimates at 50.5 percent for services sector, 34.7 percent for agriculture sector and 14.8 percent for industry sector.
Among the various occupation groups, laborers and unskilled workers comprised the largest proportion (31.6%) of the total employed population. This was also the largest occupation group in January 2007 (32.3%). Farmers, forestry workers and fishermen registered the next largest group of workers with 18.2 percent in January 2008 and 17.6 percent in January 2007.
Employed persons fall into any of these categories: wage and salary workers, own account workers and unpaid family workers. Wage and salary workers are those who work for private establishments, government or government corporations and those who work with pay in own-family operated farm or business. More than half (51.7%) of the total employed persons in January 2008 were wage and salary workers mostly working for private establishments (38.2%). Those working for the government or government corporations accounted for 7.9 percent. More than one-third of the total employed persons were own-account workers accounting for 36.1 percent with self-employed workers registering the highest share (32.3% of total employed). Unpaid family workers were estimated at 12.2 percent.
Employed persons are classified as either full-time workers or part-time workers. Full-time workers are those who work for 40 hours or more while part-time workers work for less than 40 hours. Six in every 10 employed persons in January 2008 were full-time workers, with those working for 40 to 48 hours having the highest proportion (40.8% of total employed). Part-time workers comprised 35.3 percent of the total employed.
Employed persons who want or desire additional hours of work are considered underemployed. Most of the underemployed were found in the agriculture sector at 49.3 percent. Underemployed persons in the services sector accounted for 35.8 percent while those in the industry sector, 14.9 percent. About 61.2 percent of the underemployed were reported as visibly underemployed, or had been working for less than 40 hours a week.
The unemployment rate in January 2008 was estimated at 7.4 percent. Among the regions, the NCR had the highest unemployment rate. It registered a 2-digit unemployment rate of 12.5 percent. Males had higher unemployment rate of 7.8 percent compared to females at 6.7 percent. For every ten unemployed, five (49.6%) were in the age group 15-24 years, while three were in the age group 25-34. Around 39.0 percent of the unemployed had attained college level and 33.5 percent were high school graduates.
(Sgd.) CARMELITA N. ERICTA
Administrator
Technical Notes
- Starting with the July 2003 round of the Labor Force Survey (LFS), the generation of the labor force and employment statistics adopted the 2003 Master Sample Design.
- Using this master sample design, the number of samples increased from 41,000 for LFS conducted from January 1997 to April 2003 to around 51,000 sample households for July 2003 and subsequent rounds of the LFS.
- The province of Basilan became part of Autonomous Region in Muslim Mindanao while Isabela City (Basilan) of Region IX, in accordance with Executive Order No.36.
- The 1992 four-digit code for Philippine Standard Occupational Classification (PSOC) and 1994 Philippine Standard Industry Classification (PSIC) were used in classifying the occupation and industry.
- Starting April 2005, the new unemployment definition was adopted per NSCB Resolution Number 15 dated October 20, 2004. As indicated in the said resolution, the unemployed include all persons who are 15 years and over as of their last birthday and are reported as: (1) without work and currently available for work and seeking work; or (2) without work and currently available for work but not seeking work for the following reasons:
1.) Tired/believed no work available
2.) Awaiting results of previous job application
3.) Temporary illness/disability
4.) Bad weather
5.) Waiting for rehire/job recall
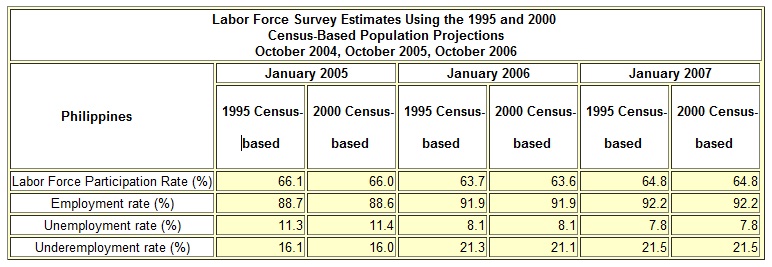
- Starting with the January 2007 LFS round, the population projections based on the 2000 Census of Population was adopted to generate the labor force statistics. This is in compliance with NSCB Resolution No. 1 series of 2005 entitled "Adoption of the Methodology Used in Generating the 2000 Census of Population and Housing-Based National Population Projections". Estimates of employment indicators using data from previous LFS rounds and the 2000 Census-based population projections, and another set of estimates using the 1995 Census-based population projections, are presented below for comparison.
Source: Income and Employment Statistics Division
Household Statistics Department
National Statistics Office
Manila, Philippines
Page last revised: March 19, 2008